Basically, we are focusing on two relationships: 1. Relation between Average Cost and Marginal Cost, and 2. Relation between Total Cost and Marginal Cost.
Details are as under:
1. Relation between Average Cost and Marginal Cost:
Relation between average cost and marginal cost is explained through Table 8 and Fig. 9.
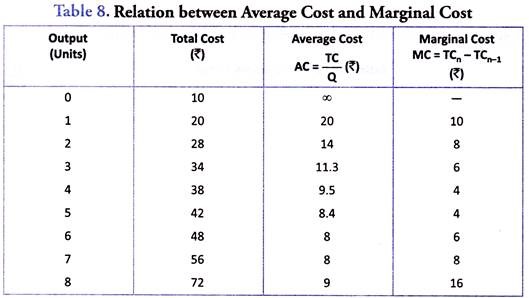
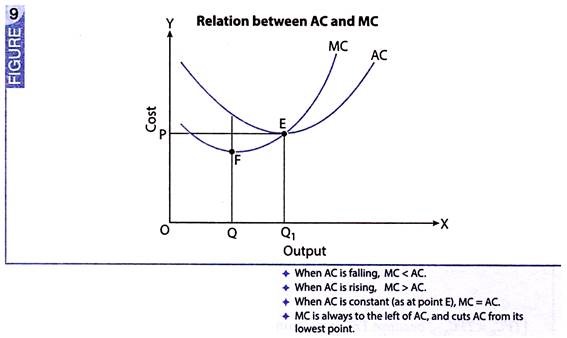
Table 8 and Fig. 9 offer the following observations with regard to the relation between average cost and marginal cost:
(1) When AC Falls, MC is Lower than AC:
When average cost falls, marginal cost is less than AC. In Table 8, AC is falling till it becomes Rs.8, and MC remains less than Rs.8. In Fig. 9, AC is falling till point E, and MC continues to be lower than AC. In this case, marginal cost falls more rapidly than the average cost. That is why when marginal cost (MC) curve is falling, it is below the average cost (AC) curve. It is shown in Fig. 9.
(2) When AC Rises, MC is Greater than AC:
ADVERTISEMENTS:
When average cost starts rising, marginal cost is greater than average cost. In Table 8, when AC rises from Rs.8 to Rs.9, MC rises from Rs.8 to Rs.16. In Fig. 9, AC starts rising from point E. And, beyond E, MC is higher than AC.
(3) When AC does not Change, MC is Equal to AC:
When average cost does not change, then MC = AC. It happens when falling AC reaches its lowest point. In Table 8, at the 7th unit, average cost does not change. It sticks to its minimum level of Rs.8. Here, marginal cost is also Rs.8. Thus, Fig. 9 shows that MC curve is intersecting AC curve at its minimum point E.
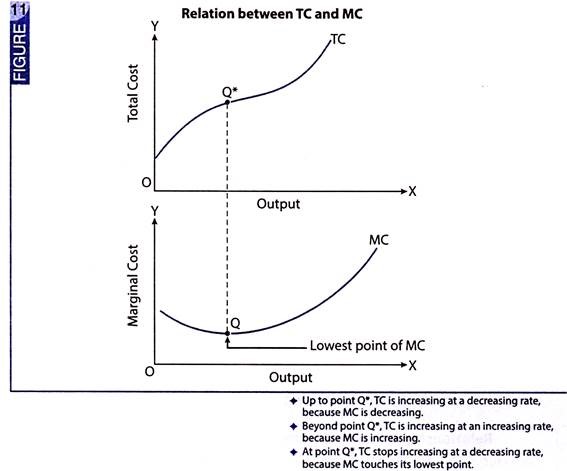
2. Relation between Total Cost and Marginal Cost:
Table 8 and Fig. 11 offer the following observations with regard to the relation between total cost and marginal cost:
ADVERTISEMENTS:
(i) Marginal cost is estimated as the difference between total costs of two successive units of output. Thus,
MCn = TCn – TCn-1
(ii) When MC is diminishing, TC increases at a diminishing rate.
(iii) When MC is rising, TC increases at an increasing rate.
(iv) When MC reaches its lowest point (point Q in Fig. 11), TC stops increasing at a decreasing rate (point Q* in Fig. 11).
Briefly, MC is the rate of TC.