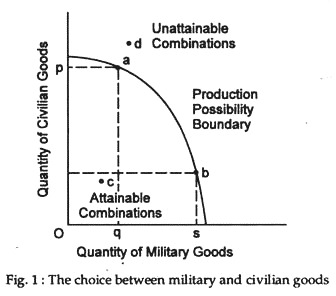
The following points highlight the seven applications of Production Possibility Curve (PPC). The applications are: 1. Scarcity 2. Opportunity Cost 3. Specialisation 4. Marginal Decision Making 5. The Irrelevance of Sunk Costs 6. Economic Growth 7. International Trade.
Application # 1. Scarcity:
Since resources are scarce, only limited quantities of goods and services can be produced. However, resources have alternative uses. So, more of one commodity can be produced by reducing the production of another commodity. In fact, the only ways to produce more of all goods and services are to increase the quantity of resources and to use resources more efficiently.
Application # 2. Opportunity Cost:
To produce certain amount of one good means giving up certain amount of other goods. The slope of the PPC measures opportunity cost ratios or transformation cost ratios. A full employment economy must always give up some units of one commodity to get more of the other. This is the essence of the opportunity cost principle.
Application # 3. Specialisation:
As society produces more and more of one type of good, it has to sacrifice or give up a constant, an increasing or a decreasing amount of other types of goods depending on whether marginal opportunity costs are constant, increasing or decreasing.
ADVERTISEMENTS:
Since resources tend to be specialised, if they are diverted from one use to another their marginal contribution falls. In other words, opportunity cost increases. This is why the PPC is usually concave to the origin showing increasing slope. If opportunity cost remains constant when resources are transferred from one use to another the PPC will be straight-lined with constant slope.
Application # 4. Marginal Decision Making:
No doubt, PPC shows society’s menu of choice but the question is: How does the society choose at which level on PPC to produce? In effect, society begins at an extreme point under vertical axes and produces only one commodity then it gradually moves point by point along the PPC towards the horizontal axes. Thus, it produces more of clothing by reducing the production of food.
At each point society is faced with a question: Do we want to produce at this point or move on to the next point, even though moving on will mean giving up additional units of one commodity? Each move means that society believes that the additional benefits it will derive will exceed the marginal opportunity cost it will incur. Society finally stops at a point where it believes that the next move would cost more than the benefits it would receive.
Individuals also behave in the same way — by making marginal calculations. We all trade-off one activity for another until the marginal opportunity cost of an additional amount of the first activity equals the marginal benefits of that additional amount. This is known as decision making at the margin. When the additional production of some defence goods such as guns or the additional quantity of some actives being considered, marginal (additional) opportunity cost come into play.
Application # 5. The Irrelevance of Sunk Costs:
ADVERTISEMENTS:
The PPC also illustrates that choices made and costs incurred in the past do not influence current or future choices. Costs incurred in the pasts are known as sunk (or historical) costs. Marginal choices necessarily ignore past choices.
For example, a society having selected a particular point on the PPC, at which to produce, faces a marginal choice of whether to move to another point along the curve. Society cannot go back to the beginning and produce the goods it decided not to produce before. It has already incurred the opportunity cost of moving to its current position.
Application # 6. Economic Growth:
The PPC can also be used to throw light on two other real life problems. First of all, a rightward shift to the PPC indicates expansion of society’s production capacity. This leads to faster economic growth.
The magnitude of shift of PPC over time depends on two things:
ADVERTISEMENTS:
(a) Increase in supply of resources, and
(b) Technological progress which increases the productivity of existing resources.
Application # 7. International Trade:
The final point to note here is that, trade between two countries is possible only when their opportunity cost ratios with respect to the production of any two commodities differ. This means that the PPCs of the two countries should differ in shape and slope. Otherwise gainful trade between them is not possible. By drawing the PPCs of the two countries, we can study their pattern of cooperative advantage.
The concept of opportunity cost can well be represented graphically. In Fig. 3 we show a hypothetical economy which is using all its resources to produce only two commodities, say, food and clothing abbreviated as/and c.
The vertical axis measures food output and the horizontal axis output of clothing. It is possible for a society to produce alternative combinations of these two commodities by using all its resources (with existing technology). The following table shows the possible combinations of the two commodities a society is capable of producing when all its resources are fully and most efficiently employed.
From Table 1 we see that when all the resources are used to produce only one commodity, say food, the maximum output is 35 units (measured in quintals). Likewise, if all resources are used to produce only clothing maximum output will be 50 units (measured in yards). These are two extreme possibilities. All other possibilities are also summarised in Table 1.
The information contained in Table 1 can be represented graphically, as in Fig. 1. The different combinations of food and clothing are shown by points like a, b, c, d, e and f in Fig. 1. The focus of all such, points is the production possibilities curve (PPC) of society.
It describes all the possible combinations of any two commodities that can be produced by an economic system by using all resources with maximum possible efficiency. Thus, any point on the curve is not only a full-employment point but also an efficient point. The implication is that, if society is inside the PPC its actual output will be less than its potential (full employment) output because of the existence of unemployed resources.
Graphical Representation of Opportunity Cost:
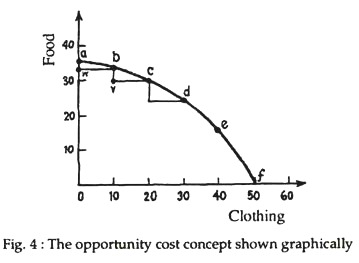
The PPC has been drawn to illustrate the concept of opportunity cost graphically. Suppose, our hypothetical economy is producing only one commodity, say food. In this case it would be at point ‘a’ in Fig. 4. Output of food is 35 units. Now, suppose, it decides to produce 10 units of clothing. In that case it would move from point ‘a’ to ‘b’ on this curve.
ADVERTISEMENTS:
Consequently, output of food has to fall by 2 units (from 35 to 33). Thus, the opportunity cost of 10 units of clothing is 2 units of food or opportunity cost of one limit of clothing is 2/10 = 1/5 unit of food. Or, alternatively, the opportunity cost of 1 unit of food = 5 units of clothing.
Thus for a movement along the curve from point a to b the opportunity cost of clothing is the vertical distance aw- which means that 2 units of food must be given up as a result of the decision to produce 10 units of clothing. Here, the distance aw measures opportunity cost and the distance wb opportunity gained. Since the PPC is concave to the origin the opportunity cost gradually increases. Here bv is greater than aw. The implication is that for a movement along the PPC from b to c, 3 (instead of 2) units of food have to be sacrificed to produce the same 10 units of clothing.


