The following points highlight the six main uses of the production possibility curve. The uses are: 1. Unemployment 2. Technological Progress 3. Economic Growth 4. Present Goods Vs. Future Goods 5. Economic Efficiency 6. Economizing Resources.
Production Possibility Curve: Use # 1. Unemployment:
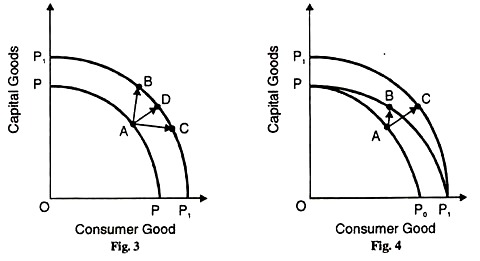
If we were to relax the assumption of full employment of resources, we can know the level of unemployment of resources in the economy. Such a situation is depicted in Figure 3 where the curve PP depicts substantial unemployment in the economy.
It implies either idle resources or inefficient use of resources within the economy. The economy can attain the full employment level by utilizing its resources fully and efficiently. At the level of full- employment the economy can have more of capital goods at point B, or more of consumer goods at point C, or more of both the goods at point D.
Production Possibility Curve: Use # 2. Technological Progress:
Technical progress enables an economy to get more output from the same quantities of resources. By relaxing the assumption of given and constant production with the help of the production possibility curve the increase in the production of both the goods than before.
ADVERTISEMENTS:
Suppose the economy is producing certain quantities of consumer goods and capital goods as represented by the production possibility curve PP0 in Figure 4. Given the supplies of factors, if the productive efficiency of the economy improves by technological progress, its production possibility curve will throughout shift outwards to P1 P1 .It will lead to the production of more quantities of both consumer and capital goods, as shown by the movement from point A on PP0 curve to point С on P 1P1 curve.
If technical progress takes place in the production of only one of the two goods, say consumer goods, the new production possibility curve will be PP1 in Figure 4. It may be noted that even though technical progress is limited to one product, it enables the economy to have more of both goods.
Increased productivity in consumer goods industry makes it possible to increase the output of this industry. At the same time, it releases resources which can be employed to raise the output of capital goods. Figure 5 shows that technical progress brings about a greater increase in capital goods than in consumer goods CD > AB, while Figure. 6 shows a greater increase in consumer goods than in capital goods, AB > CD.
Production Possibility Curve: Use # 3. Economic Growth:
By relaxing the assumptions of the fixed supply of resources and of short period, the production possibility curve helps us in explaining how an economy grows. The supplies of resources like land, labour, capital and entrepreneurial ability are fixed only in the short run.
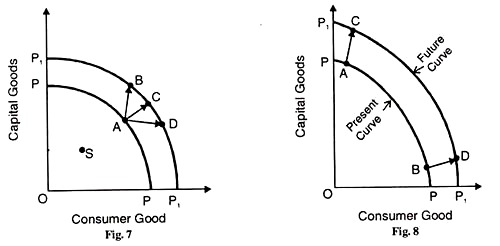
Development being a continuous and long run process, these resources change over time and shift the production possibility curve outwards as shown in Fig. 7.
If the economy is stagnant at, say point S, economic growth will shift it to point A on the production possibility curve PP, and a further increase in the resources may shift the production possibility curve towards the right to P1P. The economy will produce at point C. Why point С? Because when there is economic growth, the economy will have larger quantities of both consumer and capital goods than before.
Production Possibility Curve: Use # 4. Present Goods Vs. Future Goods:
ADVERTISEMENTS:
An economy that allocates more resources in the present to the production of capital goods than to consumer goods will have more of both kinds of goods in the future. It will thus experience higher economic growth. This is because consumer goods satisfy the present wants while capital goods satisfy future wants.
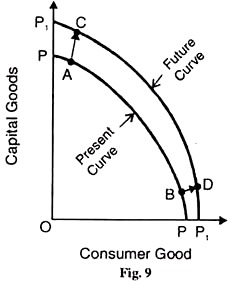
Figure 8 shows that the outward shift of the economy’s future production possibility curve P1P1 from point A of the present curve PP is greater when more capital goods are produced in the future. On the other hand, Figure 9 shows lesser outward shift of the present curve PP from point В to the future curve P1P1 when less capital goods are produced in the future.
In addition to the above, we can depict any number of different pairs of goods or services on the production possibility curves, such as public vs private goods, agricultural vs. non-agricultural goods, consumption vs. investment (or saving), etc.
Production Possibility Curve: Use # 5. Economic Efficiency:
The production possibility curve is also used to explain what
Prof. Dorfman calls the “three efficiencies:
(i) Efficient selection of the goods to be produced,
(ii) Efficient allocation of resources in the production of these goods and efficient choice of methods of production,
(iii) Efficient allotment of the goods produced among consumers. These are in fact the central problems of an economy which are related to what Samuelson calls “what, how and for whom” to produce.
Production Possibility Curve: Use # 6. Economizing Resources:
ADVERTISEMENTS:
The production possibility curve tells us about the basic fact of human life that the resources available to mankind in terms of factors, goods, money or time are scarce in relation to wants, and the solution lies in economizing these resources.
As aptly put by Samuelson, “Economic scarcity refers to the basic fact of life that there exists only a finite amount of human and non-human resources, which the best technical knowledge is capable of using to produce only a limited maximum amount of each and every good, as shown by the Production Possibility Frontier. And thus far, nowhere on the globe is the supply of goods so plentiful or the tastes so limited that the average man can have more than enough of everything he might fancy.”


