Notes on the Theory of Demand:- 1. Meaning and Definitions of Demand 2. Notes on Demand Function 3. Factors Determining Individual Demand 4. Factors Determining Market Demand 5. Demand Schedule 6. Demand Curves 7. Law of Demand 8. Movement along a Demand Curve and Shifts in the Demand Curve 9. Kinds of Demand 10. Inter-Related Demands.
It must be remembered that demand in Economics is always stated with reference to a particular price. Any change in price will normally bring about a change in the quantity demanded. In addition to price, demand is also used in reference to a particular period of time. For Example- demand for umbrellas will not be as high in winter as during rains. The demand for any commodity or service, therefore, must be stated with reference to the price and the relevant point of time.
Notes on Demand:
We know that people have numerous wants which vary in intensity and quality. Just desiring or wanting things is not enough to create a demand. Suppose, a mill worker desires or wants to have a car but does not have the necessary means to buy it.
This desire is ineffective and will not become a demand. Similarly, a miser may desire to have the car, has means to purchase it, but will not spend the money. His desire would also not constitute a demand. Thus, we define demand for a commodity or service as an effective desire, i.e., a desire backed by means as well as willingness to pay for it.
ADVERTISEMENTS:
The demand arises out of the following three things:
i. Desire or want of the commodity.
ii. Ability to pay,
iii. Willingness to pay.
ADVERTISEMENTS:
Only when all these three things are present then the consumer presents his demand in the market.
“Demand for a commodity is the quantity which a consumer is willing to buy at a particular price at a particular time.”
“The demand for anything, at a given price, is the amount of it which will be bought per unit of time at that price.” -PROF. BENHAM
ADVERTISEMENTS:
“By demand, we mean the quantity of a commodity that will be purchased at a particular price and not merely the desire of a thing.”-HANSEN
Notes on the Demand Function:
Demand function shows the relationship between quantity demanded for a particular commodity and the factors influencing it. It can be either with respect to one consumer or to all the consumers in the market.
A consumer’s demand for a commodity is influenced by the following factors:
1. A consumer’s demand for a commodity is influenced by the price of that commodity. Usually the higher the price, the lower will be the quantity demanded.
2. A consumer’s demand for a commodity is influenced by the size of his income. In most cases, the larger the income, the greater will be the quantity demanded.
3. A consumer’s demand for a commodity is influenced by the prices of related commodities. They may be complementary or substitutes.
4. The tastes of the consumers.
In technical language, it is said that the demand for a commodity is a function of the four variables like:
q = f(P, Y, Pr, T)
ADVERTISEMENTS:
Where q stands for quantity demanded, P stands for the price of the commodity in question, Y stands for the income of the consumer, Pr indicates prices of the related commodities and T denotes the Tastes of the consumer and f stands for function. But in practice the three of these four variables remain constant. And hence the demand function takes the form of-
q = f(P)
Notes in the Factors Determining Individual Demand:
Demand is not dependent on price alone. There are many other factors which affect the demand of a product.
These factors are as follows:
ADVERTISEMENTS:
1. Price of the Product:
Demand for a commodity depends on its price. As price rises, for a normal good, demand falls and vice-versa. However, there are exceptions, i.e., for Giffen goods, as price rises demand also rises.
2. Income of the Consumer:
A key determinant of demand is the level of income i.e., the higher the level of income the higher the demand for a given commodity. Consumer’s income and quantity demanded are generally related positively. It means that when income of the consumer rises he wants to have more units of that commodity and when his income falls he reduces the demand.
ADVERTISEMENTS:
In consumer theory, an inferior good is a good that decreases in demand when consumer income rises i.e., increase in income reduces the demand because the consumer shifts his consumption to superior goods and forgoes his existing product. Thus reducing its demand.
Cheaper cars are examples of the inferior goods. Consumers will generally prefer cheaper cars when their income is constricted. As a consumer’s income increases the demand for cheap cars decreases and demand for costly cars increases.
3. Prices of Related Goods:
Consumption choices are also influenced by the alternative options available to users in the relevant market place. Market information regarding alternative products, quality, convenience and dependability all influence choices.
The two products may be related in two ways- Firstly, as complementary goods and secondly as substitute goods.
Complementary goods are those goods which are used jointly and consumed together like tennis ball and a racket, petrol and car. The relationship between the price of a product and the quantity demanded of another is inverse. For example if the price of cars were to rise, less people would choose to buy and use cars, switching perhaps to public transport-trains. It follows that under these circumstances the demand for the complementary good petrol would also decrease.
ADVERTISEMENTS:
Goods which are perceived by the consumer to be alternatives to a product are termed as substitute goods. There is direct relationship between the demand for a product and the price of its substitute. Example- scooter and a motorcycle, tea and coffee.
The increase in price of tea would decrease its quantity demanded and people would switch over to its substitute commodity coffee.
4. Consumer’s Tastes and Preferences:
Demand for a product is also affected by the tastes and preferences of the consumers. As tastes and preferences shift from one commodity to the other, demand for the first commodity reduces and that of the other rises.
5. Expectation of Future Prices:
The current demand of a product also depends on its expected price in future. If future price is expected to rise, its present demand immediately increases because the consumer has a tendency to store it at low prices for his future consumption. If, however the price of a product is expected to fall then he has a tendency to postpone its consumption and as a result the present demand would also fall.
ADVERTISEMENTS:
This is often the case on Budget Day, when consumers rush to fill their petrol tanks prior to an expected increase in taxation. The reverse is also true, in that an expectation that prices are about to fall, will decrease current demand, as consumers will await for the expected price reduction.
6. Economic Conditions:
The demand for commodities also depends upon prevailing business conditions in the country. For, example- during the inflationary period, more money is in circulation and people have more purchasing power. This causes an increase in demand of various goods even at higher prices. Similarly, during deflation (depression), the demand for various goods reduces in spite of lower prices because people do not have enough money to buy.
Notes on the Factors Determining Market Demand:
Market demand for a commodity means the sum total of the demand of all individuals. Market demand depends, not only on the prices of the commodity and prices of related commodities but also on the number of factors.
These are:
1. Pattern of Income Distribution:
ADVERTISEMENTS:
If National income is equitably distributed, there will be more demand and vice-versa. If income distribution moves in favour of downtrodden people, then demand for such commodities, which are used by common people would increase. On the other hand, if the major part of National income is concentrated in the hands of only some rich people, the demand for luxury goods will increase.
2. Demographic Structure:
Market demand is influenced by change in size and composition of population. Increase in population leads to more demand for all types of goods and decrease in population means less demand for them. Composition of population also affects its demand. Composition refers to the number of children, adults, males, females etc., in the population.
When the composition changes, for example, when the number of females exceeds to that of the males, then there will be more demand for goods required by women folk.
3. Government Policy:
Government policy of a country can also affect the demand for a particular commodity or commodities through taxation. Reduction in the taxes and duties will allow more persons to enter a particular market and thus raising the demand for a particular product.
ADVERTISEMENTS:
4. Season and Weather:
Demands for commodities also depend upon the climate of an area and weather. In cold hilly areas woolens are demanded. During summer and rainy season demand for umbrellas may rise. In winter ice is not so much demanded.
5. State of Business:
The levels of demand in a market for different goods depend upon the business condition of the country. If the country is passing through boom, the trade is active and brisk. The demand for all commodities tends to rise. But in the days of depression, when trade is dull and slow, demand tends to fall.
Demand Schedule:
The demand schedule in economics is a table of quantity demanded of a good at different price levels. Given the price level, it is easy to determine the expected quantity demanded. This demand schedule can be graphed as a continuous demand curve on a chart where the Y-axis represents price and the X-axis represents the quantity.
According to PROF. ALFRED MARSHALL, “Demand schedule is a list of prices and quantities”. In other words, a tabular statement of price-quantity relationship between two variables is known as the demand schedule.
The demand schedule in the table represents different quantities of commodities that are purchased at different prices during a certain specified period (it can be a day or a week or a month).
The demand schedule can be classified into two categories:
1. Individual demand schedule;
2. Market demand schedule.
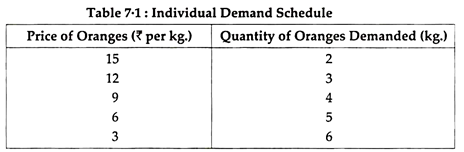
1. Individual Demand Schedule:
It represents the demand of an individual’ for a commodity at different prices at a particular time period. The adjoining table 7.1 shows a demand schedule for oranges on 7th July, 2009.
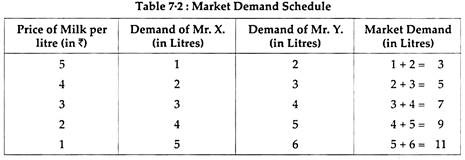
2. Market Demand Schedule:
Market Demand Schedule is defined as the quantities of a given commodity which all consumers will buy at all possible prices at given moment of time. In a market, there are several consumers, and each has a different liking, taste, preference and income. Every consumer has a different demand.
The market demand actually represents the demand of all the consumers combined together. When a particular commodity has several brands or types of commodities, the market demand schedule becomes very complicated because of various factors. However, for a single item, the market demand schedule is rather simple. Study the market demand schedule for milk in table 7.2.
Demand Curves (Diagram):
The demand curve is a graphic statement or presentation of the relationship between product price and the quantity of the product demanded. It is drawn with price on the vertical axis of the graph and quantity demanded on the horizontal axis.
Demand curve does not tell us the price. It only tells us how much quantity of goods would be purchased by the consumer at various possible prices.
Depending upon the demand schedule, the demand curve can be as follows:
1. Individual Demand Curve
2. Market Demand Curve
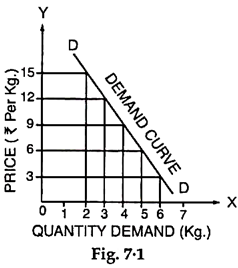
1. Individual Demand Curve:
An Individual Demand Curve is a graphical representation of the quantities of a commodity that an individual (a particular consumer) stands ready to take off the market at a given instant of time against different prices. In Fig. 7.1, an Individual Demand Curve is drawn on the basis of Individual Demand Schedule given above in table 7.1.
2. Market Demand Curve:
A Market Demand Curve is a graphical representation of the quantities of a commodity which all the buyers in the market stand ready to take off at all possible prices at a given moment of time. In Figure 7.2 a Market Demand Curve is drawn on the basis of Market Demand Schedule given in Table 7.2.
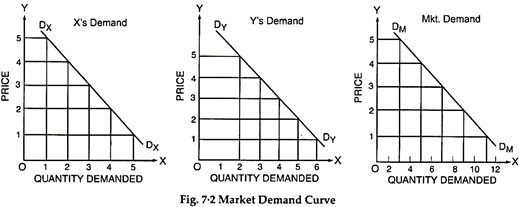
Both, the individual consumer’s demand curve is a straight line. A demand curve will slope downward to the right.
It is not necessary, that the demand curve is a straight line. A demand curve may be a convex curve or a concave curve. It may take any shape provided it is negatively sloped.
Notes on Law of Demand:
The law of demand expresses functional relationship between price and the quantity. It has been universally observed that people buy more quantity of goods when, they are available at a lower price and the quantity purchased declines with an increase in its price.
“A rise in the price of a commodity or service is followed by a fall in quantity demanded, and a fall in price is followed by an increase in quantity demanded”. Thus, lower the price, the larger is the quantity demanded of a commodity and vice-versa.
The law thus, states that other things being equal the quantity demanded varies inversely with price. Lower the price, greater is the effective demand; higher the price; lesser is the effective demand.
Characteristics of Law of Demand:
The law of demand has three specific characteristics:
1. General Tendency,
2. Relation to Time, and
3. Price and Demand Relationship.
1. General Tendency:
The law simply indicates a general tendency of changes in quantity demanded with the changes in prices. However, it does not mention any specific propositions of changes in quantity demanded with changes in prices.
2. Relation to Time:
The law of demand is always related to time, because the price changes from time to time and these are never fixed. Thus, the co-relation between the prices and the quantities demanded should be considered for a specific time or at particular instant.
3. Price and Demand Relationship:
The increase or decrease in the prices does affect the quantity demanded at a particular time. Thus, the change in the quantity demanded cannot be considered without change in prices. It must, therefore, be noted that the relationship between price and quantity demanded is relative.
i. The income of the consumer remains same during the period under consideration.
ii. The prices of related goods remain unchanged during the period.
iii. The preferences and tastes of consumers must remain the same during the period of consumption.
iv. The quality of similar goods available in the market is almost unchanged.
v. During the period under study, it is presumed that prices are not likely to change in near future.
vi. No substitutes for the commodity in question are available.
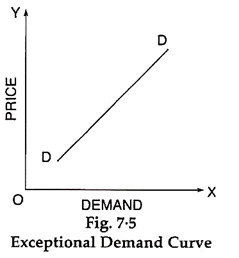
Exceptions to the Law of Demand:
There are certain exceptions to the law of demand. It means that under certain circumstances, consumers buy more when the price of a commodity rises and less when the price falls. In such case the demand curve slopes upward from left to right i.e. demand curve has a positive slope as is shown in Fig. 7.5. Many causes can be attributed to an upward sloping demand curve.
1. Ignorance:
Sometimes consumers are fascinated with the high priced goods from the idea of getting a superior quality. However, this may not be always true. Superior/deceptive packing and high price deceive the people. This can be called as ‘Ignorance effect’.
2. Speculative Effect:
When the price of a commodity goes up, people may buy larger quantity than before, if they anticipate or speculate a further rise in its price. On the other hand, when the price falls, people may not react immediately and may still purchase the same quantity as before, waiting for another fall in the price. In both the cases, the law of demand fails to operate. This is known as speculative effect.
3. The Giffen Effect:
A fall in the price of inferior goods (Giffen Goods) tends to reduce its demand and a rise in its price tends to extend its demand. This phenomenon was first observed by SIR ROBERT GIFFEN, popularly known as Giffen effect.
He observed that the working class families of U.K. were compelled to curtail their consumption of meat in order to be able to spend more on bread Mr. Giffen, British economist, observed that rise in the price of bread caused the low paid British workers to buy more bread.
These workers lived mainly on the diet of bread, when price rose, as they had to spend more for a given quantity of bread, they could not buy as much meat as before. Bread still being comparatively cheaper was substituted for meat even at its high price.
4. Fear of Shortage:
People may buy more of a commodity even at higher prices when they fear of a shortage of that commodity in near future. This is contrary to the law of demand. It may happen during times of war and inflation and mostly in the case of goods which fall in the category of necessities of life like sugar, kerosene oil, etc.
5. Prestigious Goods:
This is explained by Prof. Thorsfein Vebler Veblen. If consumers measure the desirability of a good entirely by its price and not by its use, then they buy more of a good at high price and less of a good at low price, Diamond, Jewellery and big cars etc., are such prestigious goods. In their case demand relates to consumers who use them as status symbol.
As their prices go up and become costlier, rich people think it is more prestigious to have them. So they purchase more. On the other hand, when their prices fall sharply, they buy less, as they are no more prestigious goods. This is known as (Veblen effect) or (Demonstration effect).
6. Conspicuous Necessities:
Another exception occurs in use of such commodities as due to their constant use, have become necessities of life. For example, inspite of the fact that the prices of television sets, refrigerators, washing machines, cooking gas, scooters, etc., have been continuously rising, their demand does not show any tendency to fall. More or less same tendency can be observed in case of most of other commodities that can be termed as ‘Upper-Sector Goods’.
7. Bandwagon Effect:
The consumer’s demand for a good may be affected by the tastes & preferences of the social class to which he belongs. If purchasing diamond becomes fashionable, then, as the price of diamond rises, rich people may increase their demand for diamonds in order to show that they are rich.
8. Snob Effect:
People sometimes buy certain commodities like diamonds at high prices not due to their intrinsic worth but for a different reason. The basic object is to display their riches to the other members of the community to which they themselves belong. This is known as Snob appeal.
Movement along a Demand Curve and Shifts in the Demand Curve (Diagrams):
1. Change in Quantity Demanded — Movement along a Demand Curve:
Extension and Contraction of Demand- The quantity demanded of a product does not remain constant, but keeps on changing due to various factors. If the quantity demanded changes due to change in price only, it is called expansion and contraction of demand. If price decreases, it results in expansion of demand and if price increases it results in contraction of demand. This situation is shown by movement along the same demand curve.
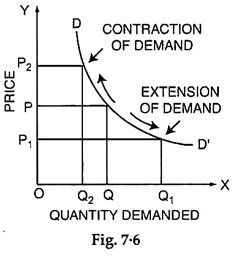
In figure 7.6, we have shown expansion and contraction of demand. At price OP, quantity demanded is OQ. If price reduces to OP1, the quantity demanded increase to OQ1. This increase of quantity demanded would be called expansion of demand. If, however, price increases from OP to OP2, then quantity demanded decrease in equality would be called contraction of demand.
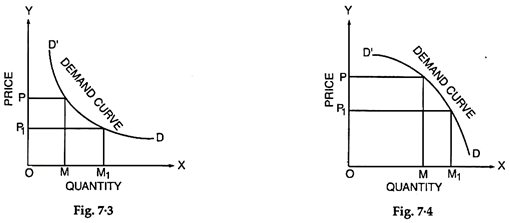
2. Change in Demand— Shifts in the Demand Curve:
Increase and Decrease of Demand:
If the change in quantity demanded of a product takes place due to any factor, other than price of the product, then it is called increase or decrease of demand. This phenomenon is shown by a shift in the entire demand curve. For example- if the income of the consumer rises then his entire demand curve shifts to right which shows that consumer’s demand for the product has increased for every given price.
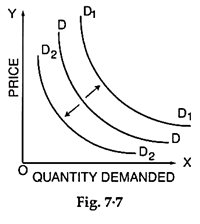
In the figure 7.7 we can say if demand increases due to increase in income then demand curve shifts to right from DD to D1D1. If, however, the demand decreases due to fall in income then the demand curve shifts to left from DD to D2D2.
Kinds of Demand:
The demands can be classified as:
1. Price Demand
2. Income Demand
1. Price Demand:
The price demand refers to various quantities of a commodity or services that are purchased at a given time and at given prices from the market. However, in such studies, the consumer’s taste, his income, habit and prices of related goods are assumed to be unchanged. Price demand has inverse relation with the price i.e., if the price of a commodity increases, its demand decreases and as the price decreases, its demand increases.
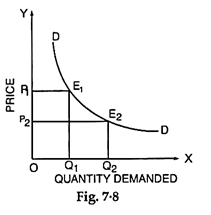
It can be seen in Fig. 7.8, when the price of the commodity was OP1, the quantity demanded was OQ1. When the price reduced to OP2, the quantity demanded increased to OQ2. Hence the price and the quantity demanded of a commodity show an inverse relationship.
2. Income Demand:
The income demand refers to the various quantities of a commodity or service purchased by the consumers at different income levels. It is assumed that the price of commodity, price of related goods and consumers’ tastes do not change. Under such conditions, with the increase in income, a consumer may purchase increased quantity of the commodity even though there may not be any fall in price.
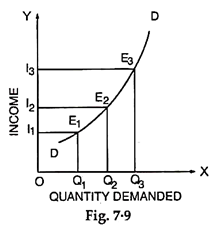
Fig. 7.9 exhibits the direct relationship between income of a consumer and demand of a commodity. As can be seen in the figure that as the income of the consumer increases from OI1 to OI2, the demand of the commodity increases from OQ1 to OQ2. Similarly when the income increases from OI2 to OI3, the demand of the commodity raises from OQ2 to OQ3.
3. Cross Demand:
Cross demand refers to the quantity of a commodity which would be demanded as a consequence of changes in price of related complementary or substitute goods.
(i) In the Case of Substitutes:
A rise in the price of good y (say Coffee) raises the demand for good x (Say Tea), similarly, a fall in the price of y, (Coffee) the demand for x (Tea) falls. Fig. 7.10. illustrates it.
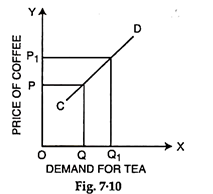
When the price of good y (Coffee) increases from OP to OP1 the quantity of good x (Tea) also increases from OQ to OQ1. The cross demand curve CD for substitutes is positively sloping.
(ii) In the Case of Complementary:
In case of complementary goods such as pant and shirt, pen and ink, car and petrol, etc., a fall in the price of one good y (Say car) will raise the demand for good x (Say petrol). Conversely a rise in the price of y (Car) will bring a fall in the demand for x (Petrol). This is illustrated in Fig. 7.11.
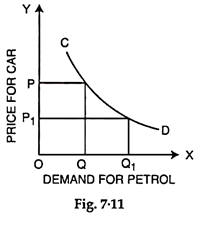
When the price of y (Car) falls from OP to OP1, the demand for x (Petrol) increases from OQ to OQ1. The cross demand curve in case of complementary goods CD is negatively sloping.
Inter-Related Demands:
It has been assumed that demand of a particular commodity is quite independent of demand for other goods. But in actual life, most of the demands are closely inter-related.
From a practical point of view, the inter-related demands can be classified as:
1. Joint Demand
2. Direct Demand and Derived Demand
3. Composite Demand
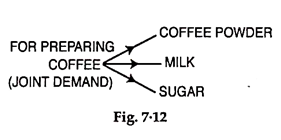
1. Joint Demand:
When several items are demanded for one particular purpose such demand is known as Joint Demand. Demand for complementary goods is also known as Joint Demand. For example, for fabrication of furniture, the items required are wood, nails, varnish, etc.
Thus, whenever the demand of furniture increases, the demand of wood, nails, etc., also increases. This is called a Joint Demand. Similarly, for the construction of the houses, the demand for bricks, cement, masons, labourers, etc., will constitute a Joint Demand. The Joint Demand for coffee is denoted by the given line diagram (Fig. 7.12).
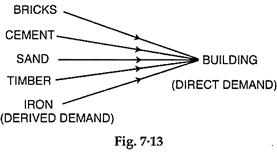
2. Direct Demand and Derived Demand:
Whenever several items are required to make a particular commodity, the demand for various commodities is termed as the Derived Demand and demand of ultimate commodity is called as Direct Demand. For example, the demand for building is a direct demand and demands for cement, bricks, sand, timber, etc., are called as derived demands. It is denoted by the given line diagram (Fig. 7.13).
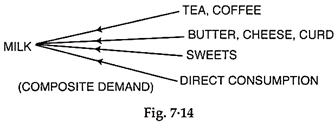
3. Composite Demand:
A commodity can be used for several purposes and its demand is directly linked to its sweets various uses such a demand is known as Composite Demand. For example, milk is used for making tea, coffee, butter, cheese, curd, sweets and for direct consumption. The total demand of milk in the market is for all such purposes and it is called composite demand, denoted by the given line diagram (Fig. 7.14).