This article throws light upon the top three input-output models. The models are: 1. The Cumberland – Isard/Daly I/O Models 2. The Modified Leontief Abatement Model 3. The Ayres-Kneese Model.
1. The Cumberland – Isard/Daly I/O Models:
John Cumberland, in 1966 was one of the first to amend the famous Leontief Input-Output model to include pollutants and other such externalities into the model to account for the fact that pollutants were in fact a cost to be reckoned with. He added rows and columns to the traditional model to highlight the benefits and dis-benefits associated with any economic activity on a sectoral basis.
Row R measures the environmental effects of any development project or program, and consists of monetary estimates of any environmental benefits by sector, as shown in row Q, minimus estimates of environmental costs by sector, Row C.
The entries in column B represent the costs that would have to be incurred by the public and private sectors of the regional economy in order to neutralize adverse environmental effects and to restore the environment to its base period quality levels.
ADVERTISEMENTS:
This formulation attempts to place monetary values on environmental effects rather than measuring them in purely physical terms. However, this method to implement based on the qualitative nature of environmental impacts as well as the need to convert measurable pollutants such as discharge per unit air, water and soil to monetary values.
An important characteristic of this model is that it does not incorporate the flows into the economy from the environment and vice versa. Thus the environment and Vice versa. thus the environmental rows and columns do not measure environment- industry coefficients.
Rather they refer to the environmental effects of a specified regional development project or program. Cumberland intended that his extended input-output model to be used as an aid to an empirical regional policy or development tool. This model is much closer to a “cost-benefit” analysis of environmental effects than to an analysis of the inputs and outputs of ecological commodities .
The lsard/Daly Model:
ADVERTISEMENTS:
Isard and Daly developed similar approaches along the Cumberland lines to the extension of environmental issues into the input-output framework. Both models are comprehensive in their approach. Each model shows the interactions both within and between the economic and environmental systems.
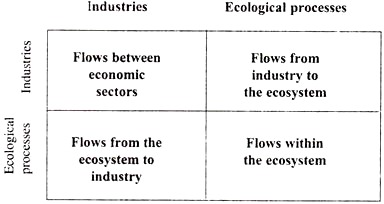
A general flows matrix that incorporates both economic and environmental activities was developed as shown:
Daly created a highly aggregated industry-by-industry economic sub-matrix and a classification of processes: ecosystem processes such as plants and animals; non-life processes such as chemical reactions in the atmosphere; and, the sun as the primary source of energy, lsard refined the Daly model through the distinction that the production of one-product is not consistent with the multiple of pollution indices created within one industry.
ADVERTISEMENTS:
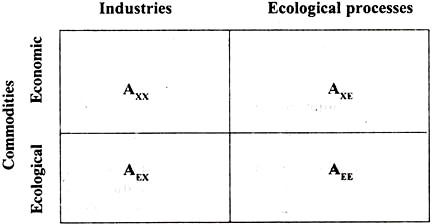
Hence, lsard employs a commodity-by- industry scheme. The commodity-by-industry scheme permits an accounting of multiple commodities, economic and ecologic, produced by a single industry.
In the lsard model shown below, commodity flows are measured along the rows starting from basic trading commodities such as wheat and cloth at the top of the table and transitioning to more boundary commodities such as crude oil down to ecologic commodities such as plankton and fish.
Activities are measured in the columns ranging from industries such as agriculture and textiles at the left of the table through petroleum refining and sport fishing to ecological processes such as plankton and fish production.
There are three major issues regarding the Isard table:
(1) There is very little information available regarding the AEE matrix, the interrelationships within the environment.
(2) There is an assumption of linear relationships within the ecological system. Ecological processes are often non-linear and exponential in nature.
(3) There is an assumption that ‘free’ environmental resources remain stable over time. Changes in resource quality could greatly affect the invariant nature of the production functions.
All three of these models, by Cumberland, Isard and Daly, were all considered as excellent forays into an otherwise ignored phenomena. The models were a first at a time when pollution was still considered a micro-issue, and that it would not affect mankind overtime. Such ignorance, if left to lumber, would have cost us dearly in introspection.
ADVERTISEMENTS:
However, much was still left pending; how were we to explain and more importantly account for those disservices to the environment which were otherwise ignored (such as carbon monoxide emissions, effluent discharge etc.).
The whole concept of book-keeping and economics were so interrelated, that anything outside the realm of what needed to be financially accounted for, was ignored. The social cost was still a concept unconcealed.
2. The Modified Leontief Abatement Model:
Pollution, according to Leontief, is a byproduct of regular economic activities. In each of its many forms it is related in a measurable way to some particular consumption or production process: The quantity of carbon monoxide released in the air bears, for example, a definite relationship to the amount of fuel burned by various types of automotive engines; the discharge of polluted water into our streams and lakes is linked directly to the level of output of the steel, the paper, the textile and all the other water using industries and its amount depends, in each instance, on the technological characteristics of the particular industry.
Leontief s input-output analysis describes and explains the level of output of each sector of a given national economy in terms of its relationships to the corresponding levels of activities in all the other sectors.
ADVERTISEMENTS:
In its more complicated multiregional and dynamic versions the put approach permits us to explain the spatial distribution of output and consumption of various goods and services and of their growth or decline, as the case may be, over time.
Frequently unnoticed and too often disregarded, undesirable byproducts (as well as certain valuable, but unpaid for natural inputs) are linked directly to the network of physical relationships that vovern the day-to-day operations of our economic system.
The technical interdependence between the levels of desirable and undesirable outputs can be described in terms of structural coefficients similar to those used to trace the structural interdependence between all the regular branches of production and consumption. As a matter of fact, it can be described and analyzed as an integral part of that network.
It was the purpose of Ayres-Kneese first to explain how such “externalities” can be incorporated into the conventional input-output picture of a national economy and, second, to demonstrate that once this has been done conventional input-output computations can yield concrete replies to some of the fundamental factual questions that should be asked and answered before a practical solution can be found to problems raised by the undesirable environmental effects of modern technology and un-controlled economic growth.
ADVERTISEMENTS:
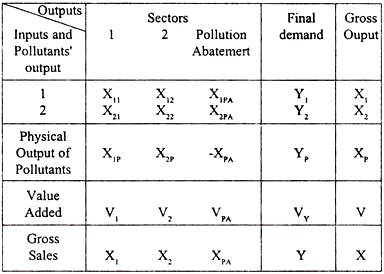
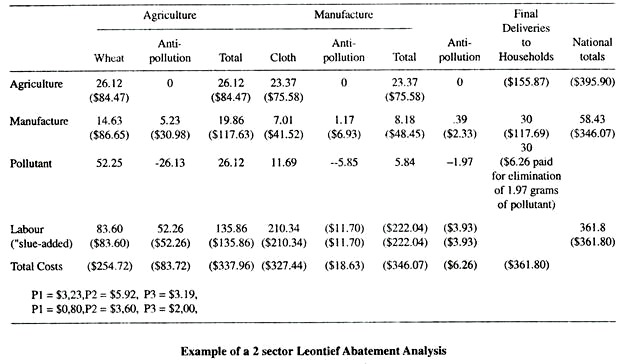
Leontief uses a simple two way model that assumes agriculture and manufacturing as two sectors that are interdependent on each other for inputs, as well as a final demand and labour (service) costs. Leontief then expresses this model using value terms (by multiplying prices of factors and services).
Subsequently, he then adds an extra row and column for pollution abatement costs. The final demand of the “pollution” is not, according to Leontief, a demand in itself, but a “tolerance limit” to what level of pollution can be borne by the final consumer.
As seen here, the extra vectors under the pollution abatement and the physical output of pollutants row/column indicate the effect that each industry has on the environment. The abatement column is expressed monetarily, whereas the physical output is in commodity values. Leontief then equates the identities for an equilibrium value. In the pre-pollution analysis, V = Y is the traditional identity, that is, value added is equal to the final demand.
However, under the post-pollution abatement expression system, we find that the final demand, is actually the value added to the commodity, minus the cost involved in pollution abatement (since Leontief assumes that the entire cost of pollution abatement is borne by the final consumer)., i.e., Y = V-Xp
This in logic, makes for cohesive analysis as clearly, if the consumer is to bear the monetary cost of abatement, then in that case, due to reduction in purchasing power etc., his final demand value will decrease to the extent of such abatement costs.
ADVERTISEMENTS:
3. The Ayres-Kneese Model:
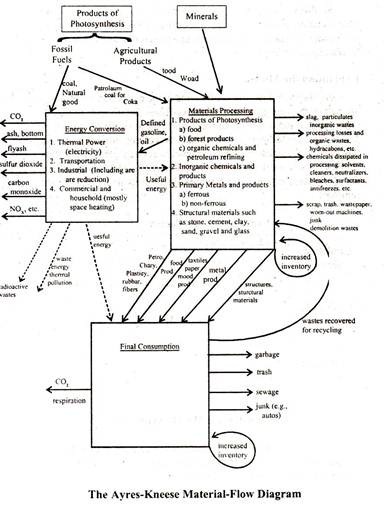
Robert Ayres and Allen Kneese in their 1969article commented on a slightly varied approach to the problem of externalities. They introduced a concept known as a materials-balance approach which broached the topic of the fact that there is an imbalance between the resources that we draw from nature, and the return of such resources back to nature.
Ayres and Kneese also applied many common laws of physics and thermodynamics to explain the concept of how matter can only be destroyed by anti-matter, and how we were only converting out pollution problem into various forms but not actually “solving it”.
Ayres and Kneese argue the concept of pareto optimality and explain that such optimality is shattered in a case where the waste assimilative capacity of the environment is scarce, since nature does not permit the destruction of the externalities which accrue.
The main objective of their model is to make some progress toward defining a system in which flows of services and materials are simultaneously accounted for and related to welfare.
Their model’s basis can be recapitulated in the following brief points:
ADVERTISEMENTS:
1. Technological external diseconomies are not freakish anomalies in the processes of production and consumption but an inherent and normal part of them.
2. These external diseconomies are quantitatively negligible in a low population or economically undeveloped setting, but they become progressively (nonbinearly) important as the population rises and the level of output increases as the natural reservoirs of dilution and assimilative capacity become exhausted).
3. They cannot be properly dealt with by considering environmental media as air and water in isolation.
4. Isolated and ad-hoc taxes and other restrictions are not sufficient for their optimum control, although they are essential elements in a more systematic and coherent program of environmental quality management.
5. Public investment programs, particularly including transportation systems, sewage disposal and river flow regulation, are intimately related to the amounts and effects of residuals and must be planned in light of them.
Explaining the Model:
ADVERTISEMENTS:
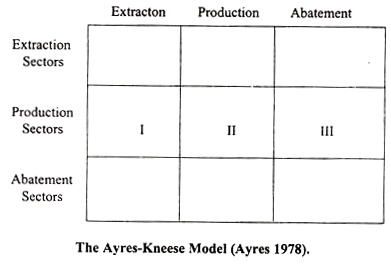
As shown below, the coefficients in the’ extraction’ column (1) are part of the conventional I-O matrix. These coefficients represent the fractional inputs (in dollars) per unit output (in dollars) of each sector.
The coefficients in the abatement column simply represent the costs of abatement to whatever level is actually achieved. In this respect, the scheme differs from that of Leontief model, which defines the coefficients in terms of dollar inputs per physical unit of pollutant removed.
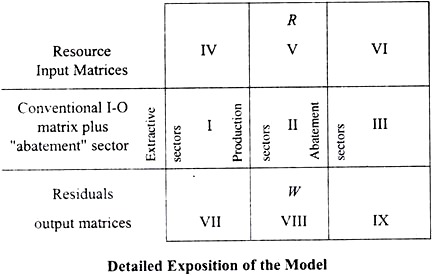
Ayres and Kneese then defines a resource input matrix R and a residuals output matrix W. Both matrices R and W, are linked together by the capital 1-0 matrix as shown below.
The Resource input matrix (IV, V, and VI) would have one row for each raw material or other resources and one column for each sector in the central 1-0 matrix. The R matrix elements would give the resource input (in physical units) per dollar output of the sector.
ADVERTISEMENTS:
Most of the resources would be collected by the extraction sectors so the majority of the non-zero elements would be upper right-hand corner (IV). In the other sub-matrices (V and VI), there may be entries for other resources such as water for dilution, air for combustion and wastes that are reused or recycled into other sectors. Each entry is in physical units per dollar of output of the sector.
The residuals output matrix, W, has one row for each pollutant that is separately accounted for in the system and one column for each industry sector (or commodity) of the main I-O table. Each coefficient of the W matrix represents residuals output, in physical units per dollar value of the product.
For the extraction matrix, VII, the columns indicate the gross residuals by extraction in physical units per dollar of output of the sector. For the production matrix, VIII, the columns represent gross production of wastes. And the abatement sectors in matrix XI, represent the net amount of residuals. Typically this number should be negative.
The Ayres-Kneese model is an extension of the Leontief pollution/abatement model. The model adds two matrices to account for the resources and wastes in physical units.
This model has the distinct advantage to close the loop of environmental impact by including both resource use and residual emissions. It inherently tracks the flows in and out of the production industries. One further insight is the ability to track abatement processes that transfer a waste from one medium to another.
Ayres and Kneese exhibit a formal mathematical framework for tracing residual flows in the economy and relate it to the general equilibrium model of resources/allocation, which are altered to accommodate recycling and containing un-priced sectors to represent the environment. It was to be the foundation of most formal pollution control analysis mechanisms in the future.
Models such as the Victor model, the United Nations model, etc. later were to be based on the above three models. This lead to a host of new discoveries about the environment and the effects of disregarding pollution as a major sources of worries.
