Meaning:
Simply speaking the occupational structure of a country refers to the division of its work force engaged in different economic activities.
Otherwise speaking how many of the total working population are engaged in agriculture and allied activities and how many of them are engaged in industrial and service sector can be known from the occupational structure of the country.
While studying the structural change in any economy, it is important to be familiar with occupational structure of the economy.
ADVERTISEMENTS:
Occupational Structure and Economic Development:
Colin Clark in his book “Conditions of Economic Progress” is of the view that there is a close relationship between economic development and occupational structure of a country. According to him, a higher per capita income is always associated with a higher proportion of the working population employed in tertiary industries while a low per capita income is always associated with a low proportion of working force employed in tertiary sector.
Otherwise speaking if the per capita real income of a country is low, the proportion of working population engaged in agriculture is high. For instance in the U.S.A. the per capita income was 2500 dollar in 1960. While 7% population was engaged in agriculture, 36% in industry and 57% in service sector.
According to the World Development Report 2002, while the per capita income of the U.S.A increased to 36240 dollar, the percentage of work force engaged in agriculture declined to 2 percent. In the same year 26% and 72% of the work force were engaged in industrial and service sector respectively. In other developed countries like the U.K., Germany, Japan etc. We find the same relationship, between the occupational structure and economic development.
ADVERTISEMENTS:
In less developed countries like India, more or less same trend is observed. For instance the per capita income of India was 60 dollar in 1960 and out of total work force 74% was engaged in agriculture 11% in industry and 15% in service sector.
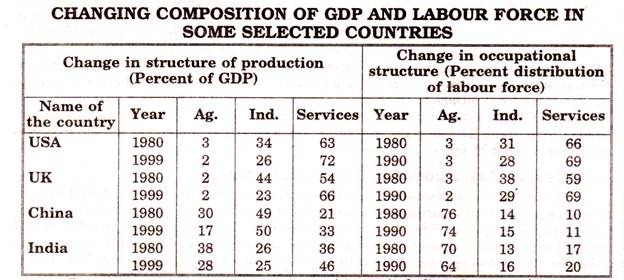
In 2000, the per capita income rise to 460 dollar and people employed in agriculture decreased to 61 percent. The following table shows comparative picture regarding structural change and change in the occupational pattern of some selected countries.
The above table shows the structural changes including change in occupational structure of both the developed and the under developed countries.
ADVERTISEMENTS:
From the date relating to occupational structure and changing composition of GDP, the following inferences are drawn:
(a) In the preliminary stage of economic growth, the proportion of the work force engaged in the agricultural and allied occupations declines.
(b) In the higher level of economic growth, the decreasing tendency increases and the absolute number of workers in primary sector declines.
(c) During the process of economic growth, the increase in work force in tertiary sector is more than that in secondary sector.
