In this article we will discuss about:- 1. Definition of Supply 2. Individual Supply and the Law of Supply 3. Market Supply Curve/Supply Curve of the Industry 4. Change in Quantity Supplied and Change in Supply, or, Movement along the Supply Curve and Shift in the Supply Curve 5. Time Characteristics of Supply.
Definition of Supply:
In ordinary language, the supply of a good means the quantity of the good that is available for sale in the market. Although a good is supplied in the market through the distributors, wholesalers, retailers and many other agencies, the ultimate supplier of a good is the firm that produces it, and it is assumed that the quantity supplied of a good per period is the same as the quantity produced of it per period.
Supply of a good in economics means the quantity produced and supplied of the good per period by its producer-firm(s) at any particular price of the good. However, supply depends on many things other than the price of the good.
For example, supply may depend on the cost of production of the good, the size and method of production, the business organisation of the firms producing it, the nature of the good, i.e., its perishability and lumpiness, the length of time obtained for effecting changes in the quantity produced, etc.
ADVERTISEMENTS:
In the definition of supply, these “all other things” are assumed to remain constant. For only then it shall be able to obtain a particular quantity of supply at a particular price. If any of these “other things” changes, then, at any particular price, it can obtain one quantity of supply in any period and another quantity of supply in another period.
Individual Supply and the Law of Supply:
In conventional economic theory, it is assumed that, at any particular price of a good, an individual firm/producer of the good would produce/supply such a quantity that would maximise his profit. This particular quantity produced, known as the equilibrium output of the firm, is the individual supply of the firm at the said price.
[The firm that adjusts the quantity to be produced taking the price as given, is a firm under perfect competition]. Now, the curve that gives us an individual firm’s supply of a good at any particular price is called an individual supply curve for the good.
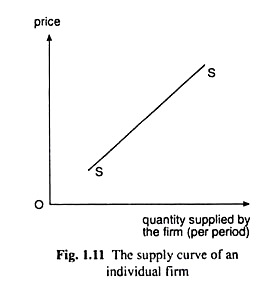
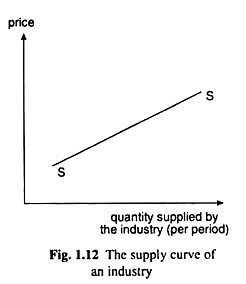
If the price of the good increases or decreases, an individual firm’s supply of the good would, generally, also increase or decrease. This is known as the law of supply. Owing to this law, an individual supply curve would generally slope upward towards right or would be positively sloped like the curves SS shown in Fig. 1.11 and 1.12.
Market Supply Curve/Supply Curve of the Industry:
On the demand side of the market for a good, there are individual buyers who demand the good. Similarly, on the supply side, there are individual firm-producers of a (homogeneous) good who are its actual sellers.
These firms, taken together, form the industry that is said to produce the good. At any particular price, the aggregate quantity of the good that all the firms taken together, or, the industry produces, is known as the market supply of the good, or, the supply of the industry.
The curve that tells us the quantity supplied of a good by the industry is called the market supply curve for the good or the supply curve of the industry. Although the individual supply curves are upward sloping, the supply curve of the industry may not always be upward sloping, like the curve shown in Figs. 1.11 and 1.12. In some cases, it may be downward sloping or even horizontal.
ADVERTISEMENTS:
Although the behaviour of an individual firm in respect of the quantity to be produced and supplied of a good forms the basis, the aggregate supply or market supply curve of a good is the ultimate of the supply theory. The market supply curve of a good, in conjunction with the market demand curve, can determine the price of the good in the market.
Change in Quantity Supplied and Change in Supply, or, Movement along the Supply Curve and Shift in the Supply Curve:
It is clear from the analysis of supply made so far that the supply of a good may change owing to a change in its price and it may also change because of a change in some other determinants of supply, e.g., cost of production. However, the nature of these two types of change in supply is not the same.
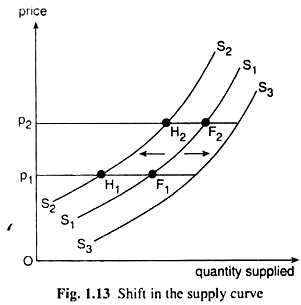
The former results in a movement along a particular supply curve. For example, if the supply curve for the good is S1S1 in Fig. 1.13, a change (increase) in price from p1 to p2 results in an increase in supply of the good from p1F1 to p2F2, and it will have to move upward towards right from the point F1 to F2 along the supply curve. Similarly, if there is a fall in price, it will have to move downward towards left along the same supply curve.
On the other hand, the second type of change in supply happens because of a change in some supply determinant (s) other than the price of the good, and it results in a shift in the supply curve. For example, suppose, initially, the supply curve of a good is S1S1 in Fig. 1.13. If now, for some reasons, the cost of production of the good increases, the market supply of the good would decrease at each price.
Suppose, at the price of pi, supply decreases from p1F1 to p1H1, and, at the price of p2, it decreases from p2F2 to p2H2. Therefore, as a result of the increase in cost of production, the (market) supply curve of the good would shift to the left from S1S1 to S2S2 that is obtained by joining the points H1, H2, etc.
Similarly, if the cost of production decreases, the supply curve of the good would shift to the right from the initial curve, S1S1, to a curve like S3S3.
In order to make a difference between the two types of change in supply, two different names for these changes are used. Change in supply owing to a change in the price of the good is called change in the quantity supplied. As a consequence of this change, a movement takes place along the same supply curve.
On the other hand, change in supply owing to a change in some supply-determinant other than the price of the good, is called change (increase or decrease) in supply—it may also be called expansion or contraction in supply. As a result of this change, the supply curve of the price good itself shifts to the right or to the left.
ADVERTISEMENTS:
Time Characteristics of Supply—Very Short- Period Supply, Short-period Supply, and Long-Period Supply:
In response to a change in the price of a good, its supply will change—but by how much will depend on the length of time available to make necessary adjustments on the supply side. If the length of time is very short so that no adjustment is possible, there would be no change in supply in response to a change in price.
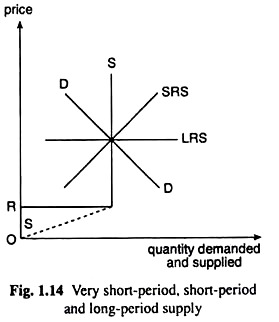
In that case, the supply curve mostly will be a vertical straight line; only when the price becomes very less, the sellers may attempt to withdraw supply from the market if price falls further. The supply curve in this case would be like the curve SS in Fig. 1.14, and it is called the very short-period supply curve.
ADVERTISEMENTS:
On the other hand, the short period or the short run is a relatively short length of time when the firm may adjust the quantities used of the so-called variable factors like labour and raw materials but cannot change the quantities of the fixed inputs like buildings, machines and equipment.
Therefore, in the short period, it would be possible for the firm to increase its output somewhat in response to an increase in price through increased use of the variable factors. That is, the short-period supply (SRS) curve will be upward sloping, although a bit steep, like the SRS curve in Fig. 1.14.
Lastly, the long run means such a long stretch of time during which the firm will be able to change the quantities of all the inputs, variable and fixed. So, now, the firm’s output or supply can adjust more easily in response to a change in price. That is why the long-run supply (LRS) curve would be, generally, upward sloping and flatters than the short-run supply curve. It would be like the LRS curve in Fig. 1.14.


