Some of the important supply curve of a firm and industry under different cost conditions are as follows:
(i) Increasing Cost Industry and Supply Curve:
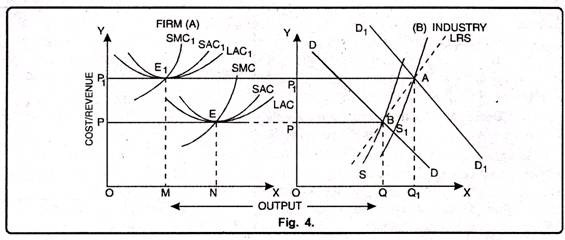
In fig. 4 (A) firm’s long run supply curve and in fig. 4 (B) industry’s supply curve has been shown. Initially, a firm is in equilibrium at point E and is producing the goods with the help of plant A. The firm produces ON output at OP cost.
If the demand curve of the industry increases from DD to D1 D1 then the equilibrium point of the industry shifts from B to A and the I equilibrium price will increase from OP to OP1 several new firms will enter the industry to take the advantage of rise in price.
As a result the demand for factors of production will increase. But in the long run, the firm will produce at the minimum average cost and may use small size plant and be in equilibrium position at E1.
In this situation, the firm will produce less OM than before at higher cost. Although an individual firm is producing less at higher cost, yet on account of entry of several new firms in the industry total supply of the industry will increase from OQ to OQ1. So AB would be the supply curve of the industry in the long run under increasing cost industry.
(ii) Constant Cost Industry and Supply Curve:
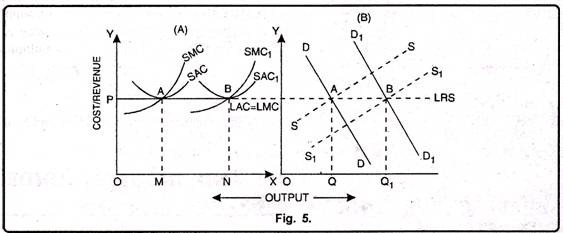
The supply curve under constant cost industry has been shown in fig. 5.
In fig. 5 (A), cost, supply and revenue curves of a firm are shown. In fig. 5 (B), demand and supply curves of an industry are shown. Supposing a firm can make use of two types of plants. SMC and SAC represent marginal cost and average cost curves of a small plant.
ADVERTISEMENTS:
SM1, and SAC1 represent cost curves of a big plant. Minimum average cost of production of both these plants is the same i.e., OP. If the firm produces OM amount of output with small plant and more than OM amount i.e., ON output with big plant, its minimum average cost remains OP.
Accordingly, at OP price firm’s LAC, LMC, SAC, SMC, MR and AR, all will be equal. All firms operating in this industry produce under constant cost. Thus in fig. no. 18(B) it is clear that demand curve DD and supply curve SS are in equilibrium at point A. At equilibrium point
A, the industry produces OQ amount of output at OP price. If due to increase in demand, the new demand curve is D1D1 and new supply curve is S1S1 then the new equilibrium is at point
B. It means at old price industry will supply more quantity than before.
(iii) Decreasing Cost Industry and Supply Curve:
ADVERTISEMENTS:
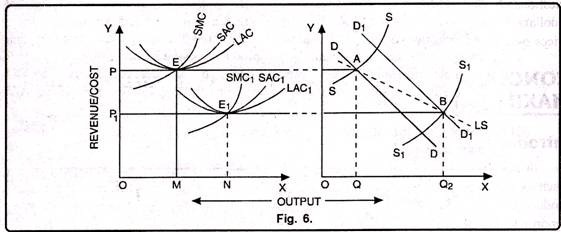
The nature of supply curve under decreasing cost industry has been shown in fig. 6. In fig. 6 (A) SMC, SAC and LAC are short-run marginal cost, short-run average cost and long-run average cost curves respectively of the firm. Initially, the firm is in equilibrium at point E, i.e., at OPEM price it produces OM output. As the industry expands, the firm gets several types of external economies. Consequently, its new equilibrium is established at point El. In this situation, firm’s output increases from OM to ON. Firm’s new cost curves, i.e.,
SMC1, SAC1 and LAC1 will shift downward. EE1 will be the long-run supply curve of the firm. In fig. 6 B long-run supply curve of the industry is shown. DD is the initial demand curve. It intersects supply curve SS at point A. Accordingly, OP price is determined where quantity demanded OQ is equal to quantity supplied. When demand increases to D1D1, new equilibrium is established at point ‘B’. On account of increase in demand, there will be increase in supply as well.


