
In this article we will discuss about:- 1. Meaning of Modern Portfolio Theory (MPT) 2. Basis of Modern Portfolio Theory (MPT) 3. Strategies 4. Mathematical Models.
Meaning of Modern Portfolio Theory (MPT):
MPT Postulates those savers are generally risk averse and try to reduce risk by all possible methods. The markets are perfect and absorb all information perfectly and returns are the same whenever you enter the market. The principal of Dominance is applied to select a portfolio as the frontier line.
MPT depends on the concepts of diversification and use of Beta for reducing the risk and the concept of Dominance for selection of a Portfolio with least risk, with returns being given.
Basis of Modern Portfolio Theory (MPT):
The Tripod on which the MPT depends are diversification of Markowitz type, concept of Dominance and use of Beta.
ADVERTISEMENTS:
A. Diversification-Investment in more than one security, asset, industry etc. with a view to reduce risks:
Diversification — an example:
Expected Return of X = 20%
Expected Return of Y = 30%
ADVERTISEMENTS:
Risk (a) of Security X = 10%
Risk (a) of Security Y = 16%
Coefficient of correlation, between X and Y can have three scenarios -1, 0.5 or + 1. Corresponding graph looks as follows:
Investment in X = 40% and in Y = 60%.
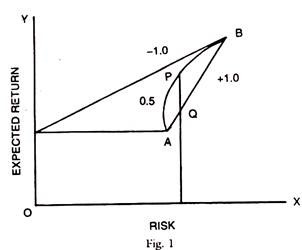
Return on Portfolio = 26% = (20 x 0.4 + 30 x 0.6)
Risk on Portfolio = 13.6%, which is normal average risk (10 x 0.4 + 16 X 0.6).
If diversification has to give an advantage, the coefficient of correlation is to be considered. If the average risk of Portfolio has to be less than 13.6%, the coefficient of correlation of these returns of X and Y has to be less than 1.0. If the coefficient is + 1.0, the return moves along the straight line AB. Suppose it is – 1.0, then the risk can be reduced to zero, because the risk of the one can be perfectly offset by that on the other.
If it is 0.5 (or anything between + 1.0 and -1.0) then the diversification can reduce the risk on the Portfolio and the return will move along the curve. This is explained easily by graphical method rather than mathematical method. If you are on the Curve AB rather than straight line AB you can improve return without increasing the risk, at say point Q from Q to P at the same level of risk.
B. CAP Theory and Concept of Dominance (Capital Assets Pricing Model):
Risk and return have a relationship. If you want to increase the return you should also be prepared to accept higher risk. You are entitled to various combinations of assets in your Portfolio. These combinations are called opportunity set — a set of all possible Portfolios given the constraint of money available for investment.
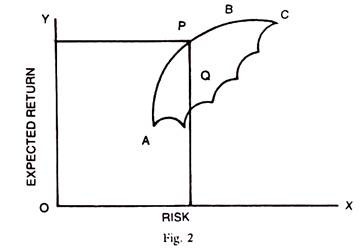
The upper boundary of the opportunity set is called the efficient frontier because by so moving, you are improving the return for the same level of risk as shown below. You move from Point Q to Point P, both of which are within the opportunity set but by such move you improve the return and this proves to be more efficient. The Portfolio Manager has to do this by constantly analysing the company’s performance/returns vis-a-vis the risk.
Dominance Concept:
ADVERTISEMENTS:
The Portfolio Manager has the opportunity to include risk-free assets in his Portfolio like a government bond or bank deposit. If he includes such risk free asset, he lowers the risk of the total Portfolio and moves from point V to point P by lowering the risk from 20% to 15% but by corresponding lowering of the expected return also (Fig. 3).
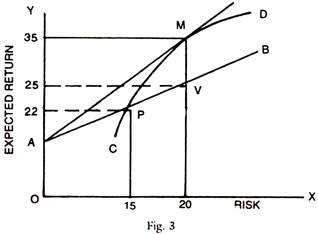
More importantly he will move on to a new efficient frontier point say from P to M. M will have the same risk as V but with a substantially higher return, say 35%. This shows that equities can be combined with bonds or other riskless assets and the concept of dominance will apply and he moves to an optimum point on the efficient frontier line (C – D).
C. Role of Beta:
ADVERTISEMENTS:
According to CAPM, the market related risk and not total risk is relevant. This systematic risk can be reduced by using Betas. It is a measure of sensitivity of the return of one asset to the market return.
Every asset will have a total return comprising two components:
(a) Risk free return — a return for mere waiting or loss of liquidity for the period of investment.
(b) Risk premium, which is return for risk taking and varies from asset to asset.
ADVERTISEMENTS:
Modern portfolio theory postulates the following axioms:
1. Diversification reduces the total risk but applicable only to company specific unsystematic risk.
2. CAPM states that where shares are correctly priced every security is expected to earn returns commensurate with the risk it carries.
3. The riskiness of a security is to be seen in the context of Portfolio or market related risk, but not in isolation.
4. The importance of Beta is for managing non-diversifiable part of risk.
Strategies of Modern Portfolio Theory:
ADVERTISEMENTS:
i. Portfolio Investment Strategy:
Different assets have different risk characteristics; some of them are also risk free assets like cash and bank deposits. Among the capital market instruments equities are most risky, followed by debentures which are less risky and then public sector bonds or government securities which are least risky. There are also money market instruments like commercial bills, treasury bills etc., which are of short duration and less risky. Thus, the risk characteristics vary from asset class to asset class.
The following major asset classes are used for Portfolios by Mutual Funds and Professional Fund Managers:
(a) Equities (Variable income instruments)
(b) Debentures, Bonds etc. (Fixed income instruments)
(c) Cash and Money Market Instruments (Short Duration Instruments).
ADVERTISEMENTS:
Asset Allocation:
Investor’s data base is the starting point for designing an investment strategy. Does he want a regular income? How regular, monthly or yearly? Does he want regular cash inflows to meet the liabilities as they fall due for repayments? What is his asset-liabilities mix or inflow-outflow pattern? Does he want only capital appreciation or a mixture of both income and capital appreciation?
Broadly investor’s objectives can be set out as income, growth and a mixture of both whatever is the objective, every investor of funds has some cash outflows, in the form of administrative expenses, salaries, wages, stationery and incidental expenses. As such some investment say from 5 to 10% is always kept in cash, bank deposits or money market instruments. The proportion in equity and debentures would depend upon the specific objective of the fund — income, growth or mixture of both.
ii. Risk Management Strategy:
Corresponding to two types of risks — diversifiable (unsystematic) and non- diversifiable risks (systematic) the portfolio risk can be managed by:
(a) Diversification and management of duration of the Portfolio. This will take care of the diversifiable risk and interest rate risk.
ADVERTISEMENTS:
(b) Use of Beta for Management of Systematic Risk.
Duration:
The concept of duration can be explained by taking the life or maturity period of the asset class. If the bond has zero coupon rate, its duration is the same as its maturity. But the duration of equity is infinity, but represented by or MP/EPS or MP/DPS where EPS is Earnings Per Share and DPS is Dividend Per Share. The average Market price is I’ and EPS is related to MP by what is called the market P/E Ratio, representing the above equation, the market P/E has its duration as 20-25 at present.
The duration of bonds of debentures is the life to maturity and the duration of cash and money market instrument is zero. Theoretical discussion on duration is generally confined to Bond Portfolio Management for which a reference may be made to the author’s book “Security Analysis and Portfolio Management.”
Example:
The duration can be made about 5 years by adopting the following investment pattern explained in a crude manner:
ADVERTISEMENTS:
15% in Equity (25 years) 0.15 x 25 = 3.75
60% in Bonds/Debentures (5 year maturity) 0.6 x 3 =1.8
25% in Money Market Instruments 0.25 x 0 =0
Total Duration = 5.55
Duration means the weighted average measure of time period of bond’s life of any asset or portfolio.
Beta:
Management of Beta is done as follows:
Beta on equity shares varies from company to company. Calculate the Betas and take the average Beta, for selected Scrips in the Portfolio. If investor wants the market risk and market return, then the Beta of the Portfolio should be 1. If the actual shares in the Portfolio give a Beta of 1.2, then an investment of 80% in equities gives the Portfolio Beta as 1.2 x 0.8 = 0.96 and the rest of the 20% is invested in bonds and money market instruments.
If the investor is risk taking then the Portfolio should be aggressive with Beta of more than 1. If on the other hand he is risk averse, the Portfolio Beta should be less than 1 and it is a defensive Portfolio. Thus, the investment strategy should be decided after laying down first the allocation of funds to different asset classes in the form of proportions and then the selection of instruments and Scrips would be decided within each asset class, based on their fundamentals.
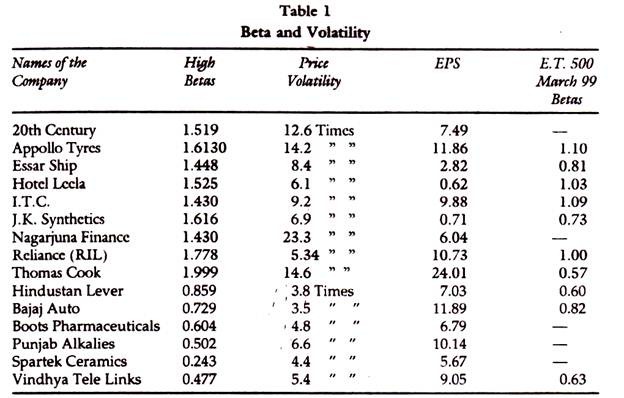
It will be seen from the Table that Betas vary with the time periods of study; high Betas based on historical data do not reflect the price volatility and there is no-guarantee that high Betas go with high return and low Betas go with low returns. Table 1 presents the data on selected companies with Betas, price volatility (High/ low ratios) Earnings Per Share (EPS) and the Betas for 1999. It is seen from the Table that historical Betas are not correlated with either price volatility or earnings per share, and that Betas change over time.
Target Return:
The basic principle in the market is that the higher the risk taken, the higher is the return. An investor who wants only risk free return can have all his funds invested in Government bonds and bank deposits which will yield only risk free return of around 10% – 14% and sometimes less. But if the investor wants to have a higher return and takes risk accordingly, then risk premium will be available to him. Assuming the riskless return as 12% if he wants a return of 25%, then the risk premium should be 13%. The portfolio Manager has to invest the majority of his funds in equities with a Beta, of more than 1. If the market return is 20% then with a Beta of 1.3, he will get 26%, which is the target return.
Borrowing for Investment:
Equities are most risky and have long duration and their Betas are high. Bonds have negligible Beta and moderate duration while Money Market instruments have negligible or zero duration. The range of Beta and duration can be widened by borrowing for investment. If a fund manager with Rs. 1 lakh borrows another Rs. 1 lakh and invests Rs. 2 lakh, in equity Portfolio, even with a Beta of 1.00, his overall Portfolio Beta is actually 2.00 because his Portfolio is Rs. 1 lakh and his equity Portfolio is Rs. 2 lakh (which is 200% of his own Portfolio). This gives almost double the returns expected and even after paying the interest component on borrowed funds, he enjoys the leverage and improves his networth. This assumes that return on capital employed is more than the cost of borrowing.
Mathematical Models of Modern Portfolio Theory:
Graphical Method can explain the portfolio selection in case of two or a few assets. Use of dominance principle asserts that those assets which show higher expected returns for the given level of risk will be selected. Dominant assets are called efficient portfolios whether they contain two or more assets. An efficient portfolio is thus any set or combination of assets that has the maximum expected return in its risk class and/or the minimum risk at the given level of expected return. The objective of Portfolio Theory is to explain the behaviour of investor in selection of efficient portfolios.
The portfolio expected return is the weighted average of the expected rates of return of the assets in the portfolio. The expected return for a portfolio denoted by E (rp) for “n” asset-portfolio is represented by-
![]()
Where x is the fraction of the total value of the portfolio invested in the i th asset. The r’s can be called weights to each of the assets. E (ri) represents the expected rate of return from the i th asset. The sum of the weights is equal to 1, or

If there are ‘n’ number of assets which are considered for investment in the market their risk and return characteristics have to be ranked in the order of highest return to lowest return and in the order of lowest risk to the highest risk. The selection of the assets can be based on some criteria of dominance say maximum expected return for a given level of risk. A computer aided mathematical program can be designed to select the assets in the portfolio, subject to save given constraints, such as a tolerable level of risk, total amount of investible funds or a minimum expected return for a given level of risk.
An efficient solution technique for portfolio selection lies in the use of differential calculus or linear programming. A general form of the Model using the mathematical programme is set out below.
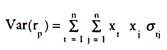
Calculus can be used to find a minimum risk portfolio for any given expected return E(x). Mathematically the problem involves the finding of the minimum portfolio variance.
Thus minimise variance:
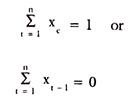
Subject to two Lagrangian constraints. Constraint Number 1 is that the desired expected return E® is achieved.
![]()
Constraint Number 2 is that the sum of the weights given to assets in the portfolio is unity.
Combining the above three equations yields the Lagrangian objective function of the risk minimisation problem with a desired return constraint.
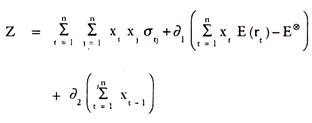
Martin A.D. Jr. solved this problem in the article published by him “Mathematical Programming of Portfolio Selection”, Management Science, January 1955.
The minimum risk portfolio is found by setting dz/dxt = 0 for t = 1 … n and dz/dλt = 0 for t = 1, 2 … n and then solving the system of equations for the xt’s.
The number of assets analysed is ‘n’ and can be any positive integer.