In this article we will discuss about the analysis of return and risk on portfolio of a company.
Return on Portfolio:
Each security in a portfolio contributes returns in the proportion of its investment in security. Thus, the portfolio expected return is the weighted average of the expected returns, from each of the securities, with weights representing the proportionate share of the security in the total investment. Why an investor does has so many securities in his portfolio? If the security “ARC” gives the maximum return why not he invest in that security all his funds and thus maximise return?
The answers to this question lie in the investor’s perception of risk attached to investments, his objectives of income, safety, appreciation, liquidity and hedge against loss of value of money etc. This pattern of investment in different asset categories, security categories, types of instruments, etc., would all be described under the caption of diversification, which aims at the reduction or even elimination of non- systematic or company related risks and achieve the specific objectives of investors.
Assuming that investor puts his funds in four securities, the holding period return of the portfolio is described in the table below:

The above describes the simple calculation of the weighted average return of a portfolio for the holding period.
Risk on a Portfolio:
Risk on a portfolio is different from the risk on individual securities. This Risk is reflected in the variability of the returns from zero to infinity. The expected return depends on the probability of the returns and their weighted contribution to the risk of the portfolio. There are two measures of Risk in this context — one is the absolute deviation and the other standard deviation.
These can be explained with following illustrations, the assumed probabilities of each of the returns and the estimation of absolute deviation and standard deviation, based on them are given for only illustration:
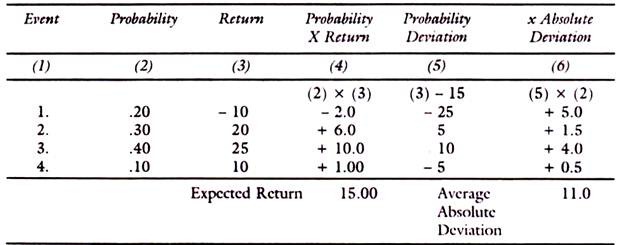
Column 5 is deviation of the returns under column 3 from the expected return 15 (Thus -25 = (-10-15). Column 6 is the result of multiplying deviation under column 5 with the probability in column 2 without considering signs. Thus, one measure of risk is absolute deviations of returns under column 6. Another measure is the standard deviation and variance-
ADVERTISEMENTS:
Standard deviation =√∑ (x – x̅)2
Variance = ∑ (x – x̅)2
The summation of all deviations from the mean and then squared will give the variance. The square root of variance is standard deviation (sd).
ADVERTISEMENTS:
x is the expected return on security.
x̅ is the mean or the weighted average return.
If two Risks are compared, then standard deviations divided by their means are compared. This is the coefficient of variation, namely (SD/X).
Example of Standard Deviation:
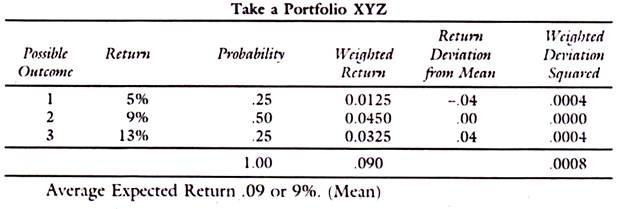
The last column of weighted squared deviations are derived by multiplying the weights of probabilities with squared deviations. Thus (.04)2 = .0016 and this multiplied by the probability of it 0.25 gives .0004 and so on.
Now, the variance is sum of the weighted squared deviations, namely, .0008
σ2 = .0008
SD √.0008 = 0 028 or 2.8%
ADVERTISEMENTS:
When the return of company XYZ is compared with that of company ABC, we have to take into account, their expected return and standard deviation of the return.
Say company A and B have the following characteristics:
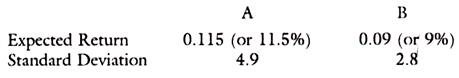
Which company do you prefer? The Company with a higher return of 11.5% has a higher risk than the other company.
ADVERTISEMENTS:
Return and standard deviation and variance of portfolios can also be compared in the same manner. Companies can be ranked in the order of return and variance and select into the portfolio those companies with higher returns but with the same level of risk.
Regression Equation:
The basic equation for calculating risk can be formulated as a regression equation-
Thus, y = α + B X + E
ADVERTISEMENTS:
Where, y = Return in the security in a given period and
X is the market return
α = The intercept where the regression line crosses the y-axis
B = The slope of the regression line
E = Error term containing all residuals
Take the following graph to illustrate the above:
ADVERTISEMENTS:
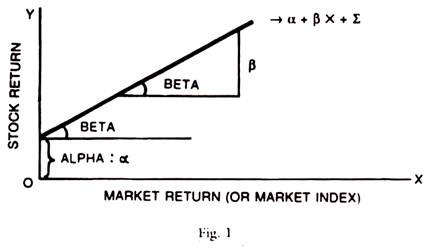
Alpha:
α or Alpha is the distance between the horizontal axis and line’s intersection with y-axis. It measures the unsystematic risk of the company. If α is a positive return, then that scrip will have higher returns. If α = 0, then the regression line goes through the origin and its return simply depends on the Beta times the market return.
Beta:
β or Beta describes the relationship between the stock’s return and the Market index return. This can be positive and negative. It is the percentage change in the price of the stock regressed (or related) to the percentage changes in the market Index. If Beta is 1, a one percentage change in Market index will lead to one percentage change in price of stock. If Beta is zero, stock price is unrelated to the Market index.
If the Beta is minus one, it indicates a negative relationship with the Market Index and if the market goes up by a + 1%, the stock price will fall by 1%. Beta measures the systematic market related risk, which cannot be eliminated by diversification. If the portfolio is efficient, Beta measures the systematic risk effectively. On the other hand alpha and Epsilon (α + ∑) measures the unsystematic risk, which can be reduced by efficient diversification.
ADVERTISEMENTS:
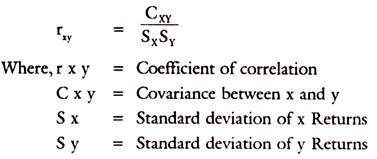
Rho or Correlation Coefficient (Covariance):
Rho measures the correlation between two stocks say i and j. If the correlation coefficient is one (+ 1), an upward movement of one security return is followed by a direct upward movement of the second security. If on the other hand, Rho is -1, the direction of the movement will be opposite as between the stock price and market index. If there is no relation between them, the coefficient of correction can be zero. It can normally vary from – 1 to 4- 1.
The equation for Rho is-

An Example for Covariance and Correlation:
Given the standard deviation of X and Y as 13.23 and 9.75 in the portfolio of two securities the covariance between them has to be estimated.
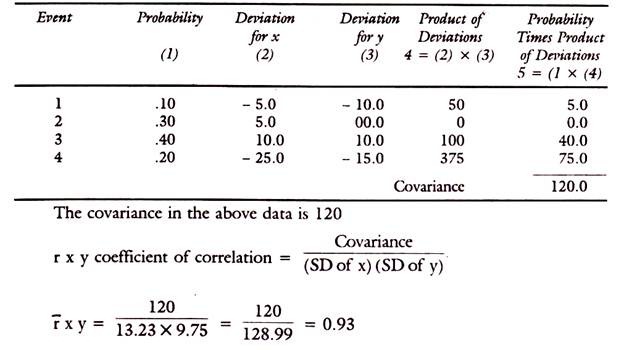
The relationship between coefficient of correction and covariance is expressed by the equation below: