The following points will highlight the three important methods to measure the national income.
Method # 1. Output (Product) Method:
The product method is based on returns made by firms and public corporations concerning the annual value of their output. In most countries these returns are obtained through the census of production.
In India, a full census is taken every 10 years and sample censuses are taken in the intermediate years. Additional information may now be obtained from returns with respect to sales tax and/or excise duty.
National income is measured by the output method by calculating the total value of goods and services produced in the country during the year. The money value of goods and services produced in an economy in an accounting year is called Gross National Product (GNP). It is defined by J. R. Hicks as “the collection of goods and services reduced to a common basis by being measured in terms of money.”
ADVERTISEMENTS:
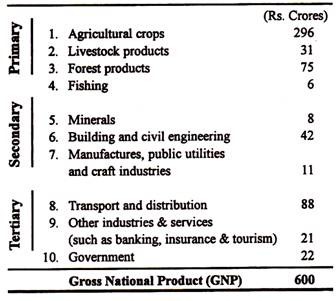
In most countries GNP or GDP is measured at current (market) prices. Table 17.1 shows the national income of a hypothetical economy in an accounting year.
Table 17.1: The National Product of a Hypothetical Economy 1998-99:
Thus, we see that all types of activities are covered—the primary sector, e.g., agriculture, forestry and fishing; secondary sector, e.g., manufacturing and construction; and tertiary sector, e.g., distribution, transport, banking and insurance.
ADVERTISEMENTS:
The national product is the total value of everything produced in the country. It is a measure of the goods and services becoming available to the nation for consumption or adding to wealth.
Problems:
When we use the output method certain problems arise:
(i) Unpaid Service:
The GNP figure includes only productive activity for which payment is received. Any unpaid service (s) will not be included. For example, housewives do a lot of work such as cooking, nursing, drawing of water, coaching children and so on. But they are not paid specifically for this. Any housekeeping allowance given to the wife by her husband is regarded as a transfer within the family. If, however, another person were employed and paid to undertake the cleaning of house, the payment to him (her) would be included in the figures, because she is providing a service for which she is being paid.
ADVERTISEMENTS:
Thus, any service which people undertake for themselves will be excluded from the figures. This indicates one area for caution in comparing national income figures for different countries. In less developed countries like India, people do more things for themselves — grow their own food, make their own clothes, etc. They do not pay for all the commodities and services they need. The national income of such a country will be that much less because most people provide so many unpaid (free) services for themselves.
(ii) Double Counting:
Another problem is drawing up the production figures is the need to avoid double-counting, i.e., including the same item twice. For example, the value of the output of the steel industry is calculated, but some of the steel has gone to the car industry to be used in the production of cars.
So if we simply calculate the value of the output of the car industry and add it to the figure for the steel industry, then some of the steel has been included twice in the calculations — once as steel and once as part of the cars.
In order to avoid this problem of double counting, it is only the value added by each industry which is included, i.e., the value of the industry’s output minus the value of the materials, etc. bought from other industries. Thus, we need figures of only the final selling values of goods and services.
(iii) Stock Appreciation:
Another problem arises due to stock appreciation. Some final goods will be added to stocks and not incorporated in other goods in the current year. On the other hand, the value of current output will include the using up of stocks inherited from the past. These problems are dealt with by including net additions to stocks, which may be positive or negative, in the domestic product.
Net addition to stock must refer to additions to the physical stock of assets and not just the money value (price x quantity) of stocks. The latter can rise because the normal accounting of firms writes up the value of stocks as price rise. Such a rise in the book value of stocks is recorded as stock appreciation.
This item takes account of the fact that stocks of goods will increase in value from one year to the next simply because of price rise. For example, if there was a stock of 100 cars in a factory last year and the same number of the same type of cars this year, the value of the stock will be greater this year, because the price of the cars has risen—yet there has been no increase in the number of cars involved.
ADVERTISEMENTS:
A deduction, therefore, needs to be made to remove the influence of price changes on stocks. In other words, stock appreciation must be subtracted from the estimates of stock changes. (As stock appreciation affects the calculation of profits, a similar deduction has to be made when using the income method).
(iv) International Transactions:
The value of goods and services produced within the country includes their import content. Imports yields incomes to owners of resources in other countries. They are part of the domestic products of other countries. Hence, they must be deducted from the GNP. Exports yield income to the domestic factors. So they are included in the domestic product. Their import is dealt with in the general deduction of imports.
So we arrive at the following estimate:
ADVERTISEMENTS:
GNP – Imports = Gross Domestic Product.
The domestic product is the value of everything produced in a particular territory. It differs from the national product by the amount of any factor incomes paid to (or by) nonresidents. This interest paid to foreigners who have provided capital in a country is included in the domestic product since it is part of the value of what has been produced in the country. But it is excluded from the national product since the income does not accrue to residents in the country.
Method # 2. The Income Method:
The income method of calculating the national incomes is based on figures collected from the income tax departments. In advanced countries the majority of people have to submit returns about income for assessment. So a fairly accurate estimate of total incomes can be obtained in this way. By contrast, in a country like India, where few people make tax returns or where there is wide-scale tax evasion, the income method is not much reliable.
The income method of calculating national income is to work out the total of all incomes received by people and organizations in the country. The national income includes the income earned by all the resources of the country from their participation in productive (i.e., money-earning) activities.
ADVERTISEMENTS:
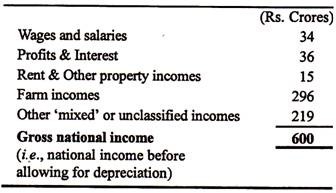
Everything that is produced in an economy belongs to someone; it may be kept by the owner of the capital used in producing it, in which case it represents the interest on his capital; it may be shared out directly among those whose labour has produced it, as with fishermen, in which case it represents their wages; or it may be bought by another man with the money income which he has earned in another form of production. It, therefore, follows that the total national product must be equal to the total national income. The following table shows the different types (sources) of income in a hypothetical economy.
Table 17.2: National Income of a Hypothetical Economy 1998-99:
The national income can thus be measured by adding up all the incomes earned by the owners of the factors of production; it includes the total of all wages and salaries earned, rents and royalties, interest received on loans, and the profits of companies, private businesses, farms, fisherman and traders. This is called national income at factor cost, because it shows the costs of production as it is paid out or imputed to the factors employed.
One can compare this with the national product and the total will be the same. It is so because the national product is the total value of everything produced in the country and is a measure of the goods and services becoming available to the nation for consumption or adding to wealth (i.e., investment).
Problems:
(i) Mixed Income:
ADVERTISEMENTS:
Although this table attempts to separate the payments to different factors of production, ‘mixed’ income are derived from a mixture of factors. So, in practice, it is virtually impossible to separate the returns to land, labour and capital. An example is a wheat farmer, whose income is derived from land, capital and labour—all supplied by himself. Again, retailers (such as grocers) provide both labour and capital, but we cannot find out how much each factor has earned.
(ii) Transfer Income:
It is important to include in the calculations only those incomes which correspond to the production of goods and services. Otherwise there may be double- entry, i.e., the same income may be counted twice. For example, a worker in a jute mill may receive Rs. 2,000 per month, of which Rs. 302 is taxed away by the government.
A freedom fighter receives a pension of Rs. 300 per month. The total income for both is Rs. 2,300; yet only Rs. 2,000 of this corresponds to productive activity. Therefore, the pension should not be included. The figure for total income would then be Rs. 2,000 — corresponding to the amount of production involved.
There are other payments which do not correspond to the production of goods and services—unemployment compensation and other social security payments, interest on government bonds, subsidies to poor families, scholarships to students, pocket money paid by parents to children, gift by one individual to another (within the same country). Such incomes are paid to the recipients out of the earnings of producers by means of taxes, insurance contributions and gifts. These incomes differ from the incomes of the factors of production, called factor incomes.
Interest on national debt is also counted as a transfer income of its recipients because it is paid out of taxes without any current goods and services being made available in return. Such payments are known as ‘transfer payments’. These are to be excluded when calculating national income.
ADVERTISEMENTS:
These are excluded from national income because such incomes do not represent payment for contributing to the production of goods and services. Thus, recipients of retirement pensions, family allowances, students’ grants and social security benefits do not make any current contribution to society’s output of goods and services.
Taxes which transfer income from the factors of production to the relevant beneficiaries are called transfer payment.
The sum-total of all incomes includes both factor incomes and transfer incomes. Since the latter are paid of the former without any goods and services being made available as a result, they exaggerate the flow of income in real terms. They are double-counted, once as factor incomes and again as transfer incomes. They must, therefore, be excluded from national income.
(iii) Imputed Income:
One item which often creates problem is ‘ownership of dwellings’. People who let out houses for rent are providing a service. So the rents received by them must be included in the national income figures. But account must also be taken of owner- occupied houses. No rent is actually paid here. But the houses provide the same service to the dwellers as rented accommodation. The problem is overcome by imputing a rent to such houses, i.e., the amount the owners would probably have received if they had rented the houses.
(iv) Government Services:
ADVERTISEMENTS:
There are many services provided by the government of a country which satisfy the collective wants of the community as opposed to the individual wants of the citizens. Thus, administration through the civil service, defence by the armed forces, protection by the police force, justice through the law courts, health care and education are provided by the state.
Each citizen does not pay according to the amount of such services that he (or she) wants. A pacifist has to help to pay for defence; a wealthy person has to help in the provision of social health and education services which he or she may never use. This list of anomalies could be greatly extended. Is it, then, realistic to include the incomes derived from producing such services as part of the income derived from satisfying wants?
In fact, government services of this kind are included in the national income on the ground that the community pays for them simply because it surely needs them.
(v) Net Factor Income from Abroad:
Some people and firms earn income by producing goods and services or owning property in other countries. Such incomes will not be included in calculations based on the earnings of factors within the country (the domestic income) and must be added to the total.
On the other hand, some of the domestic income is earned by non-residents as a result, for example, of the operation of foreign firms within a country. These incomes must be deducted when computing the national income. These two adjustments can be made together by adding net income from abroad if it is positive or by deducting it if it is negative.
Method # 3. The Expenditure Method:
A third way of arriving at this same total is to add up the total national expenditure. We have to include private and government expenditure and the value of newly — created capital. If everything we buy were produced at home and nothing were sold abroad, then the total national expenditure would be equal to the total income and to the total national product.
ADVERTISEMENTS:
But, of course, every country trades with others to a certain extent. Thus, unless the value of everything they export is equal to the value of their imports, national expenditure will be either greater or less than the national product and income.
Some countries export more than they import. They have an export surplus, which we may regard as a balance of unspent income. In such countries we have, therefore, to include the export surplus as an item in our total national expenditure. If there is an import surplus we have to deduct this from the total national expenditure.
For balancing this third account with the other two, we have to make one further adjustment. Expenditure at market prices includes, for some goods, a payment to the government as indirect tax like sales tax or excise duty. These taxes are not really a payment for any goods or services. So we deduct them from total expenditure to arrive at a final figure which is equal to the value of the national product or national income at factor cost.
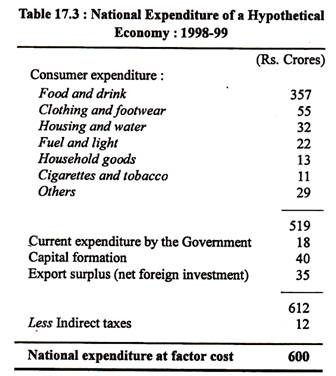
The following table illustrates this method:
The table 17.3 shows that the major portion of the national product is enjoyed by the people as food, clothing, bicycles and other ‘consumer’ goods. A certain portion goes abroad as an export surplus. It is a form of savings which can later be turned into imports, thus enabling the country (under consideration), if necessary, to consume more at some future time than its current national product. Two other components of aggregate expenditure are: private investment (capital formation) and government expenditure (on currently produced goods and services).
There are two other groups of spenders in the country whose expenditure must be included, namely, public authorities and firms. (Public authorities consist of central and local governments). With regard to the second item in Table 17.3, we are concerned only with the expenditure of public authorities on goods and services.
Expenditure on such items as pensions, student grants (i.e., loans and scholarships), unemployment benefit, etc. is not included, because such expenditure does not correspond to any production in the economy. The inclusion of such expenditure would not give a true indication of the value of the goods and services produced in the economy during the year. It is only expenditure on goods and services which is relevant here.
The expenditure method depends on somewhat less accurate statistics because of the great number of retail outlets where most of the relevant transactions take place. Information about retailing, wholesaling and the provision of some service is obtained from the Census of Distribution. Additional information is obtained from sales tax (and excise duty) returns.
Problems:
When all the items are added, we arrive at total domestic expenditure at market prices. But this is not equivalent to national income. What we have worked out so far is the total amount spent in this country on goods and services, not the total amount spent on goods and services produced in this country.
When we use the expenditure method the following problems arise:
(i) Exports and Imports:
Some of the goods produced in this country will be sold abroad. For example, when Indian cars are sold in Bangladesh, the expenditure takes place in Bangladesh and is, therefore, not included in any of the items mentioned so far in Table 17.3.
Yet the value of those cars will be included in the figure for total production in India. The same is true of all Indian exports. Therefore, if we are to ensure that Total Production = Total Expenditure, we must add to our previous figure the value of exports.
With regard to imports, the reverse is true. Money is spent in the country on goods which have not been produced in this country. For example, when we import pears from Australia, the expenditure on those pears is included in our figure for ‘Total Domestic expenditure’, yet the figure for the ‘Production’ of the pears will be included in the Australian national income statistics and not in ours. Therefore, there is again a danger of losing the equality of Total Production and Total expenditure. To remove this danger we must subtract the value of imports.
When exports and imports have been taken into account in this way, the new total is gross domestic expenditure at market prices.
(ii) Indirect Taxes and Subsidies:
However, we do not have an expenditure figure equivalent to the amount which producers receive for producing the goods and services during the year. For example, the amount paid by a consumer for a packet of cigarettes is not the amount received by the cigarette manufacturer. Part of the price is made up of tax and that money goes to the government, not to the cigarette manufacturers.
In cases like this, where there are taxes on goods and services (‘indirect taxes’ as they are called), the amount of the tax must be deducted from the expenditure figures.
The opposite argument applies to subsidies. These are amounts of money paid by the government to producers of certain goods in addition to the amounts received from the sale of the goods. For example, if there was a subsidy on milk production, the farmer would receive money from the buyers of the milk and also an extra amount from the government. To overcome this problem we must add subsidies to our expenditure figure.
When indirect taxes have been subtracted and subsidies added the total arrived at is gross domestic expenditure at factor cost, which will be the same as gross domestic product at factor cost.
We are now getting nearer to the final figure for national income, but there are still two more stages through which we must go before that figure is reached. The first of these is to take into account ‘Net factor income from abroad.’
(iii) Factor Income from Abroad:
We have covered income received from the sale of goods and services produced in this country. But some people in this country receive income as a result of their ownership of property abroad. For example, they receive interest on profits on their assets abroad.
Similarly, there is an outflow of money to people in foreign countries who own assets in this country. For example, foreign companies like the Mitsubishi Electric Company have factories in India.
When these flows of money are included in the figures—under the heading ‘net factor income from abroad’—the result is known as Gross National Product at factor cost.
This shows the total of goods and services produced over the year together with income from property held abroad. But there has been a wearing out of machinery, etc. used in the production of that output.
So, to get a true indication of the amount that production has added to the country’s wealth, one should set aside a certain amount of the year’s output to cover this wearing out of capital. Hence, the final item in the calculation — capital consumption (or depreciation). When this amount is deducted, the result is Net National Product at factor cost, or, in other words, National Income.
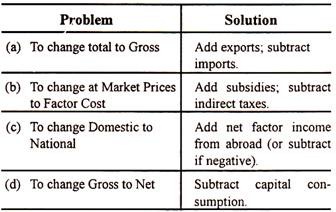
These, then, are the various stages involved in calculating the National Income. It can be seen that at each stage one word or group of words is altered and when all the necessary alterations have been made, the National Income is found.
There are four main changes to remember and these are listed below:
A Problem Common to all Methods:
The national income, product and expenditure can all appear inflated if no account is taken of the wearing out and using up of capital. The object of the computations is to measure the economic results of current activity. The production of any commodity involves the use of both labour and capital.
During the production process the capital depreciates, i.e., it is subject to wear and tear. This depreciation represents the contribution to production and income of assets inherited from previous periods and must be deducted from the totals if a realistic measure of the results of current activity is to be reached.
Gross national product minus depreciation = net national product
Gross national expenditure minus depreciation = net national expenditure
Gross national income minus depreciation = national income.
Depreciation is sometimes referred to as capital consumption, for obvious reasons. The maintaining of the capital of a country intact is of fundamental importance for ensuring a continued ability to achieve the prevailing standard of living. For measurements of capital consumption to be valid for this purpose it is necessary for them to be based on the current prices of the assets.
This is to say that depreciation must be calculated on the basis of the replacement costs, not the historical costs of relevant assets. If historical costs are used in a time of rising prices the figures for depreciation will underrate the using up of capital and thus project a falsely inflated picture of the results of current economic activity.
Another type of unmeasured production is work performed for cash and not reported as income to the government. Small jobs such as hair dressing and garbage removal are included in this category, as well as major productive activities of plumbers, painters and housekeepers.
Also, services are sometimes swapped, so that production is exchanged for production rather than cash. For example, a dentist might maintain the teeth of a lawyer in return for legal advice. Still another type of unmeasured production involves illegal goods or services, such as recreational drugs, and much underworld activities.
In recent years, the term underground economy has been used to refer to productive activities that are not reported for tax purposes and are not included in GDP. Although there is concern that these goods and services are not included in GDP, the primary concerns about the underground economy are lost tax revenue and the social harm resulting from some of these activities.
Several other important factors are related to the calculation of GDP: It fails to measure the impact of production and consumption on the environment; it does not account for future costs that may be incurred from current production; and it sometimes is not a sure indicator of changes in the quality of people’s lives.
Disposable and Personal Incomes:
Disposable income (DI) figure tells us what actually gets into our hands, to dispose-off as we wish. To get the figure we have to subtract from the GNP figure depreciation, all taxes (both direct and indirect), retained earnings of the corporate sector, and then to add transfer payments as also or interest on national debt.
The disposable income figure is important because it is the sum that people divide between consumption spending and net personal saving. Of course, people also pay interest on loans out of this income. Business people keep a close watch on the trend of DI for obvious reasons.
Like DI, personal income (PI) removes depreciation and corporate saving from GNP and adds back all transfers incomes received by households.
The distinction between personal income and disposable income is that the former does not attempt to estimate personal income tax (which is basically a direct tax). If we exclude all direct taxes, PI would be identical with DI.
Money Income and Real Income:
The most widely accepted measure of the standard of living of a country is per capita income or GNP per head. The figure is obtained by dividing the GNP by the total population. Changes in the standard of living can be assessed by comparing the figures for per capita income over periods of time.
In making comparisons between different years, it is important to use figures based on real terms rather than on money terms. The latter relates to prices but the real GNP measures physical quantities of goods and services. An increase in GNP due simply to a rise in prices leaves the community materially no better-off.
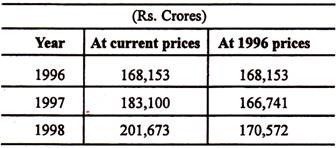
Thus, in order to compare GNP figures at different dates, allowance must be made for changes in prices. This is achieved by a method similar to the use for compiling index numbers. By this means, the output of a given year is valued at the prices of a chosen ‘base’ year—the year on which comparisons are being based. For example, if 1996 is the base year then the value of GNP or per capita income in succeeding years is estimated at constant (1996) prices.
In fact much of increase in national income figures between two years may be due merely to price increases. For example, in 1996 India’s national income was Rs. 183,800 crores and in 1997 it was Rs. 201,073 crores. This shows a rise of about 9%. But during 1998 the rate of inflation was 4.6%; so this would account for much of the rise in national income. Therefore, the money income has to be deflated by the price index to arrive at real income.
The equation for determining real GDP is
money GDP for a given year/price index number for that year x 100
= real GDP for the given year.
If exactly the same amount of goods and services were produced in India in 1998 as were produced in 1997, the national income figure on 1998 would still be greater because the prices of the goods and services have risen. The problem arises because the national income for each year is given in terms of current prices.
One way of overcoming this difficulty is to measure national income at constant prices. By this method, the national income figures for various years are given in terms of the prices prevailing during one particular year. In the right hand column of Table 17.4, the national income figures for 1996, 1997 and 1998 are given at 1996 prices. We now clearly see the effect of eliminating price changes.
Table 17.4: National Income at Constant Prices (hypothetical figures):
Even so, the comparison is not very accurate. It is because there are various problems connected with the construction and use of index numbers.
Secondly, there may be an increase in national income figures over time without any increase in output. This may occur because of nonmonetary transactions becoming monetary ones. The national income statistics include only transactions involving money. Therefore, if a transaction, which was previously nonmonetary, becomes a monetary one, the national income figure will increase, even though the same amount of work is done as before.
A simple example may make the point clear. Suppose in 1998 a housewife did all the clearing in the house herself, but in 1999 she decided to pay a cleaner Rs. 100 a month to do this. The national income for 1999 would be Rs. 1,200 greater than the 1998 figure for this reason alone—yet there has been no change in the amount of work done. The same argument would apply to a man who previously serviced his own car but who then decided to take it to a garage to be serviced.
