Study Notes on Isoquants. After reading this article you will learn about: 1. Meaning of Isoquants 2. Properties of an Isoquant 3. Ridge Lines: The Economic Region of Production.
Meaning of Isoquants:
The Greek word ‘iso’ means ‘equal’ or ‘same’ and ‘quant’ is the short form of quantity. Thus an isoquant is a curve along which output is the same. For the sake of analysis, we are assuming that a producer employs two inputs—labour (L) and capital (K).
A firm can produce a certain amount of a commodity by employing different combinations of labour and capital. When this information is plotted on a graph paper, we obtain an isoquant.
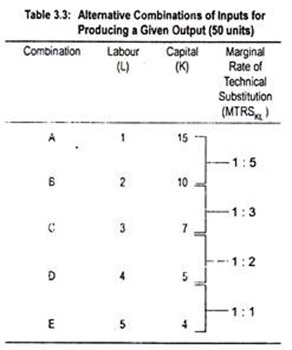
A particular level of output may be obtained if the above combinations of labour and capital are utilized (Table 3.3):
The above table tells us that to produce 50 units of output, the producer can choose 1 unit of labour and 15 units of capital (i.e., combination A). However, if he chooses combination B or C or D or E, the same volume of output will be obtained.
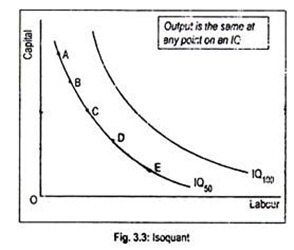
Thus, he is indifferent about what combination of inputs to choose. Whatever the combination he chooses, the firm’s output level remains fixed at 50 units. If we plot this information in a graph paper, we will obtain production indifference curve or equal output curve, as shown in Fig. 3.3.
In Fig. 3.3, labour is measured along the horizontal axis and capital is measured along the vertical axis. We have drawn an isoproduct curve represented by a curve IQ50. Point A on IQ50 represents just one possible combination of labour and capital which can be used to produce 50 units of output.
ADVERTISEMENTS:
Point B is another possible combination of labour and capital to produce the same level of output. But at point B, more labour and less capital are used. Points C, D and E have similar meanings. Now by joining these points we get an isoquant. Each and every point on an isoquant represents the same level of output.
Thus an isoquant represents different combinations of two inputs, i.e., labour and capital that yield the same level of output. An isoquant is a contour line showing different combinations of inputs that are physically capable of producing a given amount of output.
A family of isoquant is called isoquant map. Higher-order isoquant represents higher level of output. By employing more labour and capital, a firm can produce large output. Thus, IQ100 lies above IQ50.
In this connection, we may point out the primary difference between indifference curve and isoquant. An indifference curve represents the same level of satisfaction or utility which is not quantifiable. On the other hand, though same level of output is represented on an isoquant, output is a measurable magnitude.
Properties of an Isoquant:
Like an indifference curve in the consumer plane, a production indifference curve or an isoquant has the following properties:
ADVERTISEMENTS:
i. An isoquant normally slopes downward from left to right. Or it has a negative slope.
ii. An isoquant is convex to the origin.
iii. No two isoquants can intersect each other
We consider these properties in turn:
i. An Isoquant is Negatively Sloped:
As we move along an isoquant the amount of one input must increase while that of another must decline. If both labour and capital yield positive marginal products, then increasing the number of labour while holding the number of capital constant would increase output.
So, if we want to maintain a constant level of output when the quantity of labour (or capital) is increased, the quantity of capital (or labour) must decrease. This implies a negatively sloped isoquant. In other words, a downward slope suggests that both the inputs have positive marginal products.
ii. An Isoquant is Convex to the Origin:
Isoquant analysis assumes that the two inputs needed for producing a given level of output are substitutes, though not perfect substitutes. Thus, an isoquant is convex to the origin because of the diminishing “marginal rate of technical substitution between labour and capital” (MRTSK for L or MRTSL for K)—a concept analogous to MRSXY of an indifference curve.
The rate at which one input is substituted for another is called the MRTS. Consider the hypothetical example shown in Table 3.3. Suppose a producer moves along an isoquant from the combination represented by A to the combination B.
ADVERTISEMENTS:
We want to know how many units of capital will have to be sacrificed to get one additional unit of labour. The answer is, clearly, 5. The ratio of 5 to 1 is called the MRTS. Now, if the producer moves from B to C combination, the MRTS would be 3 to 1.
Thus, with larger quantities of labour and smaller quantities of capital to produce a level of output of, say, 50 units, the MRTS continuously declines. It is due to the diminishing MRTS an isoquant becomes convex to the origin. The Table 3.3 suggests that the MRTS (1: 5 > 1: 3 > 1: 2 > 1: 1) is declining.
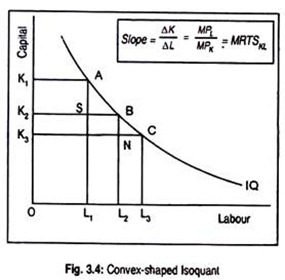
Fig. 3.4 explains the convexity of an isoquant. Let us choose points A, B and C on an isoquant. If production occurs at A, the firm would use OK, units of capital and OL, units of labour. As we move from point A to B, less capital and more labour are required to produce the given level of output. This amounts to saying that labour is substituted for capital.
ADVERTISEMENTS:
The rate at which labour is substituted for capital (i.e., MRTS) is:
OK1 – OK2 /OL1 – OL2 =AS/SB
Similarly, for movements from B to C, the MRTS is:
OK2 – OK3/OL1 – OL3= BN/NC
ADVERTISEMENTS:
Since, AS/SB > BN/NC, one can say that MRTS is diminishing and isoquant is convex to the origin. The slope of an isoquant is MRTS. Diminishing MRTS is expressed graphically by the flattening of the slope of the isoquant.
One important point is to be noted here. MRTS is related to the marginal products of two inputs. We have seen that, as MRTS declines, labour is substituted for capital. In other words,
MRTSK for L = -∆K/∆L
Since, (∆K/∆LK) is the slope of an isoquant (note the negative sign), the MRTS is given by the slope of an isoquant. And, MRTS is equal to the ratio of marginal product of labour (MPL) to the marginal product of capital (MPK).
If one moves along an isoquant, the reduction in one unit of capital must be compensated by the increase in labour input. A reduction of capital input means fall in output and an increase of labour means a rise in output. Fall in output must cancel out the increase in output, so that output level along an isoquant remains fixed.
The reduction in output following the reduction in the use of capital inputs is -∆K.MPK. The increase in output consequent upon an increase in labour inputs is +∆L.MPL. Along an isoquant, a decrease in output should exactly match an increase in output.
ADVERTISEMENTS:
That is:
-∆K.MPK = ∆L.MPL
Or, ∆K/∆L = MPL/MPK = MRTSK for L
If isoquants were concave to the origin, the MRTS between two inputs would be increasing one, rather than a diminishing one.
iii. Isoquants cannot Intersect:
There is necessity to prove this property here as we did so in connection with the consumer indifference curve. The same logic can be applied here.
Ridge Lines: The Economic Region of Production:
An isoquant represents combinations of two inputs that yield the same level of output. However, not all points of an isoquant are relevant for production. Such points may be called infeasible points. One should consider only feasible portions of an isoquant. This is because of the fact that no rational producer will produce where marginal product of an input is either zero or negative.
ADVERTISEMENTS:
If the isoquant is backward bending and upward sloping, marginal product of any input will be negative, and, hence, this portion of the isoquant may be considered as economically non-sensible region of production. Only the negatively sloped segment of the isoquant is relevant for production or economically feasible.
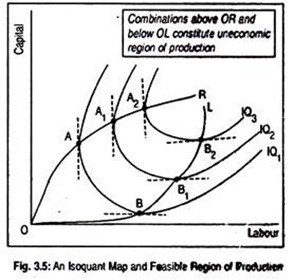
This is shown in Fig. 3.5 where we have drawn three isoquants showing different levels of output for different labour-capital combinations. This diagram separates economic region of production from uneconomic region of production. Region in which marginal products of all inputs are positive constitutes economic region of production.
Or the region in which input substitution takes place may be called economic region of production. In an uneconomic region, as marginal product of an input becomes either zero or negative, the question of input substitution does not arise. Production in such region is, for obvious reasons, unprofitable or infeasible.
At point A on IQ1, the firm employs certain units of labour and capital. Since the tangent to IQ1 at point A is parallel to the vertical axis, marginal product of capital (MPK) is zero. If more capital is used, marginal product of capital should be negative. In other words, beyond point A, MPK is negative. At point B on IQ1, MPL is zero and beyond point B on IQ1, MPL is negative.
ADVERTISEMENTS:
Thus, points between A and B represent positive marginal productivities of both labour and capital. Here substitution between two inputs takes place. Similarly, points A1and A2 on IQ2 and IQ3 describe zero MPL while points beyond A1 and A2 describe negative MPK. Points B1and B2 on IQ2and IQ3 represent zero MPK and beyond B1 and B2 describe negative MPL.
A rational producer will produce in that region where marginal productivities of inputs are positive. By joining points A, A1 and A2 (i.e., points of zero marginal products) we get OR line and by joining points B, B1 and B2 (points of zero marginal products) we get OL line. These lines are called ridge lines. They give the boundaries of the economic region of production where input substitution takes place.
Any point on the isoquants outside the upper ridge line OR and the lower ridge line OL constitute uneconomic region of production. Production must take place inside the ridge lines. Note that the ridge lines separate the relevant (i.e., negatively sloped) from the irrelevant portions (i.e., positively or zero sloped) of the isoquants.


