Let us make an in-depth study of the effect of income change and price change on consumption curve.
Effect of Income Change:
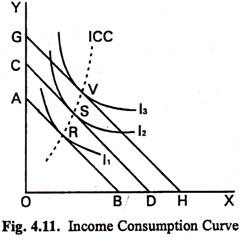
Suppose when the consumer’s income is M, the price line is AB. The equilibrium position is R where AB touches indifference curve IC1.
If the consumer’s income increases, he will be able to buy more X and Y. The Price Line will move outwards parallel to itself, becoming (say) CD. The equilibrium position of the consumer will now be S, where CD touches another indifference curve IC3. If the income increases again, the Price Line will move further outwards. If it is now GH, the consumer will be at equilibrium at V.
If we join R, S, V and similar other points of tangency we get a line like ICC. This line shows the effects of income changes on consumption. It is called the Income – Consumption Curve or the Expenditure- Consumption Curve. When income increases the consumer moves upwards along ICC; when income decreases he moves downwards along ICC.
The shape of ICC depends on the shape of the indifference curves. In case of inferior goods it will bend away from the axis which represents such goods, showing that, as income increases, the consumption of such a good decreases.
Effect of Price Change:
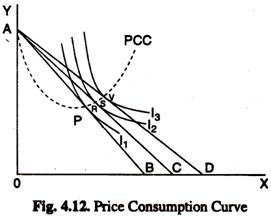
Suppose AB is the price line when the price of X is such that the consumer can buy OB with his income. The consumer is at equilibrium at R. Suppose now the price of X falls. The consumer can now buy more X. So the Price Line becomes (say) AC.
The equilibrium position is now S, where AC touches indifference curve I1. If the price of X falls further, the consumer will be at equilibrium at a point like V. A line joining R, S, V and similar other points shows the effects of price changes on consumption. It is called the Price Consumption Curve.
When the price of both the commodities change, the positions of both A and B change. The point of tangency between the new price line and an indifference curve shows the new equilibrium position. So all prices change, and their effect on the consumer’s equilibrium position, can be diagrammatically represented on the Indifference Map of the consumer.
(a) Normal Goods:
ADVERTISEMENTS:
A change in price of a commodity affects its demand. Its demand curve is affected both by the income effect and the substitution effect. The effects vary according to the nature of the commodity and the taste and preferences of the consumer. In case of normal goods, the demand varies inversely with the price.
Both the income effect and substitution effect induce the consumer to buy more of the commodity, the price of which has fallen. The ultimate effect on demand for the commodity is increase. The reverse effect occurs when price rises. These are shown in Fig. 4.12. In case of normal goods the income-elasticities of demand are positive.
(b) Inferior Goods:
Goods which are both purchased less when income rises, are called Inferior Goods. In case of such goods, the income effect is negative or weak and the substitution effect is positive or strong. The ultimate effect on demand for such a commodity is a slow increase or complete stoppages.
ADVERTISEMENTS:
For example, a man may buy less (or no) coarse cloth and use more fine cloth in its place as his income rises. The inferior goods depend on the taste of individual buyer. When a commodity has several grades and specific qualities of goods and services, any of the grades can be called inferior goods for somebody or some group of people.

