The concept of consumer surplus has several applications both in economic theory and economic policy. This concept has been used to resolve water-diamond paradox of value theory, to explain the effects of taxes and subsidies on people’s welfare, to make cost-benefit analysis of public projects, to show gains from trade etc.
We will explain below some of the applications of the concept of consumer surplus:
Application # 1. Explaining Water-Diamond Paradox:
One of the most famous puzzles in economic theory is why diamonds are more expensive than water. Water is essential for life; it is so useful that without its consumption one cannot live or survive. On the other hand, diamonds, though attractive and beautiful, satisfy less important human needs than water.
Then, how it can be that in the market less useful commodity like diamonds are so expensive and a highly useful commodity as water is very cheap. Some thinkers in the past therefore complained that something was wrong with the market system which determines high price of commodities such as diamond, gold etc. which are least useful and low price of a commodity such as water- which is necessary and highly useful. Therefore, this came to be known as water-diamond paradox.
ADVERTISEMENTS:
However, for modern economists there is no paradox about it as they are able to explain the large price differential of water and diamond. The notion of marginal utility or marginal benefit of a commodity and the concepts of consumer surplus based on it can be used to resolve the water-diamond paradox. The marginal benefit or marginal valuation per litre of water for the consumer is very low as the actual supply of water per period is very large.
On the other hand, the marginal utility or marginal benefit of diamonds is very high because the amount of diamond actually available is very small. If, in fact, only few litres of water were available, marginal valuation of water would have been much greater than that of diamonds. Note that marginal valuation of a commodity reflects how much amount of money consumer is prepared to pay for a commodity. This indicates marginal utility or use-value of the commodity for the consumer.
It is worth noting that downward-sloping demand curve for a commodity can be interpreted as showing the marginal valuation or marginal utility in terms of money to the consumer of various units of a commodity. If the quantity actually available of a commodity in the market is very large, its marginal valuation or marginal utility will be very small, though its total use-value or total benefit may be very large. On the other hand, as the actually available quantity of a commodity such as diamonds, gold etc. is very small, its marginal valuation or marginal utility is very high, though its total value-in-use or total utility is small.
Market price of a commodity is determined not by its total use-value but by its marginal valuation or marginal utility which in turn depends on the actually available quantity. The total use-value or total utility which a consumer gets from a quantity of a commodity equals the amount actually paid and the consumer surplus he obtains from it. In case of water market price as determined by its marginal utility is low but consumer surplus from it is very large.
ADVERTISEMENTS:
On the other hand, in case of diamond due to their greater scarcity, marginal utility and hence its price is large but consumer surplus from it is very small. Thus, the concept of consumer’s surplus shows that price should not be confused with total use-value of a commodity and this helps us to resolve the water-diamond paradox.
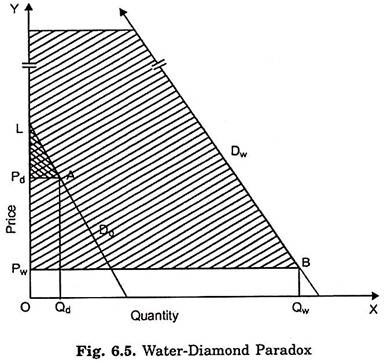
This is illustrated in Fig. 6.5 where consumer’s demand curve Dd depicts the marginal valuation curve for diamonds. On the X-axis quantity of diamonds in grams per time period and along the Y-axis marginal utility or valuation and price of diamonds are measured. Since the total use-value (i.e., total utility) of diamond is small, the demand curve is at a low level.
Suppose the quantity of diamond actually available is and, as will be seen from the figure, price of diamond determined by demand and supply is Pd which is quite high, whereas the consumer surplus equal to LAPd (shaded area) obtained by the consumers over and above what they actually pay is small.
Fig. 6.5 also illustrates the price determination of water. Demand curve Dw representing marginal valuation or marginal utility of different quantities of water is at a higher level. If the quantity of water available is a very large quantity OQw, its marginal utility equals QwB and therefore price determined is OPw. Though the market price of water is very low, consumer surplus obtained by the consumers will be the whole shaded area (not fully shown) above the price line PB which is very large compared with those of diamonds.
ADVERTISEMENTS:
To sum up, the total utility or satisfaction derived from water consumed is much greater compared with diamonds but its marginal valuation or marginal utility is low due to its abundant supply. The difference is large consumer surplus. On the other hand, total valuation (value in use) of diamonds consumed is very small due to its scarcity, its marginal utility and therefore its price is very high compared with water. The difference is very small consumer surplus.
Application # 2. Evaluating Loss of Benefit from Tax:
The notion of consumer surplus is applied for evaluating benefits and losses from certain economic policies. The losses and gains from taxes and subsidies to the consumers can be analysed using market demand curve and the concept of consumer’s surplus. First, we explain the loss in consumer’s surplus or welfare caused by the imposition of an indirect tax (say, sales tax) on cars.
We assume that supply curve of cars is perfectly elastic, indicating constant cost conditions under which the car industry is working. Under these conditions, imposition of a sales tax, say Rs. 10,000 per car sold would raise the price of car by exactly this amount, say from Rs. 1,60,000 to Rs. 1,70,000. The rise in price of car will result in fall in its quantity demanded and sold.
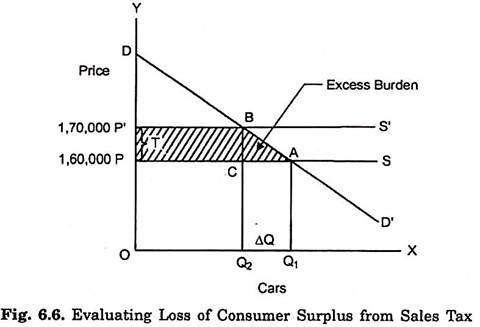
The loss in benefits incurred by the consumers as a result of the sales tax is illustrated in Fig. 6.6. The DD represents the demand curve for cars. This demand curve for cars can also be interpreted as marginal utility or marginal valuation curve of the cars for the consumers. Before the imposition of a sales tax PS is the supply curve of cars. The demand and supply for cars are in equilibrium at quantity Q1 and price OP. Thus Q1 quantity of cars is sold at price OP. In this situation consumers obtain.
APD amount of consumer surplus which measures net benefit to the consumers from the use of Q, number of cars. Now, with the imposition of sales tax of Rs. 10,000 (or PP’ = 7) the supply curve of cars shifts to P’S’. Consequently, the price of car rises from OP (Rs.1,60,000) to OP’ (Rs. 1,70,000) and number of cars sold falls to Q2. With the rise in price and fall in the number of cars sold consumer surplus is now reduced to BPD and consumers incur a loss in consumer surplus (benefit) equal to the area APP’B. This loss in consumer surplus can be decomposed into two parts.
The first part is the rectangular area, PP’BC which is equal to the tax (T) multiplied by the reduced number of cars Q2, (PP’BC = TQ2) and arises due to the increased expenditure on Q2 number of cars consequent to the imposition of the sales tax. The area PP’BC or Q2T also represents the revenue collected by the Government from levying sales tax.
The second component of loss in consumer’s surplus is the triangular area ABC which measures the loss in consumer surplus on account of the decrease in number of cars sold, that is, OQ or Q1Q2 as a result of levying of sales tax. In this way, the total loss in consumer surplus is PP’BA = PP’BC + ABC. Where PP’BC is also equal to tax per car (i.e., T) multiplied by the reduced numbers of cars sold (i.e., Q2), that is, TQ2 and the triangular area ABC which equals 1/2 T.ΔQ. Thus, loss in consumer surplus (PP’BA) = TQ2 + 1/2 T.ΔQ.
ADVERTISEMENTS:
It is worth noting that the loss in consumer surplus PP’BA is greater than the revenue collected by the Government which is equal to the area PP’BC and this extra loss in consumer surplus is equal to the triangular area ABC. This area ABC represents the excess burden of sales taxation. The net loss in welfare or consumer surplus in excess of tax revenue received by the Government is also called dead weight loss. If instead of sales tax, a lump sum tax of an equal amount were levied, there would have been no excess burden.
Thus, sales tax distorts the price of cars reduces the number of cars sold and thereby results in loss in consumer welfare in, excess of the amount of tax collected. Therefore, economists dub indirect taxes such as sales tax or excise duty as economically inefficient.
Thus, it follows that the burden of indirect tax (such as sales tax or excise duty) is greater than the direct tax such as lump sum tax or income tax. Therefore, many economists hold that from the viewpoint of social welfare or optimum allocation of resources, the direct taxes such as a lump sum tax or income tax is superior to an indirect tax such as sales tax or excise duty.
Let us show and illustrate it with the help of Fig. 6.6 which represents the case of constant cost industry. With the given demand and supply curves DD’ and PS respectively price OP and equilibrium quantity OQ1 are determined. This is the position before the imposition of the tax and represents the maximum satisfaction or welfare of the people.
ADVERTISEMENTS:
Now, if the sales tax equal to PP’ per unit of the commodity is imposed the supply curve will shift upward to the position P’S’. As a result, the price will rise to OP’ and the quantity demanded and sold will fall to Q2. Tax collected by the Government in this case will be equal to PP’BC, but the loss in consumer’s surplus suffered by the consumer will be equal to PP’BA.
Now, if the Government takes away the sum equal to PP’BC through a direct tax, say lump sum tax or income tax, then the people would not have to suffer the loss equal to the area ABC. This is so because whereas an indirect tax distorts the price of a commodity (i.e. it raises the price), a lump sum or income does not affect the price.
Thus, it is clear that a direct tax causes less loss of welfare than a price-distorting indirect tax. However, it should be remembered that this conclusion is based on the assumption that the total welfare is maximum before the imposition of any tax.
Application # 3. Evaluating Gain from a Subsidy:
The concept of consumer surplus can be used to evaluate the gain from subsidies. The Government these days provides subsidies on many commodities such as food-grains, fertilizers, power. Let us take the example of subsidy on food-grains production being given by the Government. Suppose the subsidy reduces the price of food-grains from Rs. 400 to Rs. 300 per quintal.
ADVERTISEMENTS:
As a result of the fall in price of food-grains due to subsidy being provided for its production, the quantity demanded of food-grains increases from 10 thousand quintals (Q1) to 12 thousand quintals (Q2). Now, the question to be answered is what will be net social benefit or gain from this subsidy.
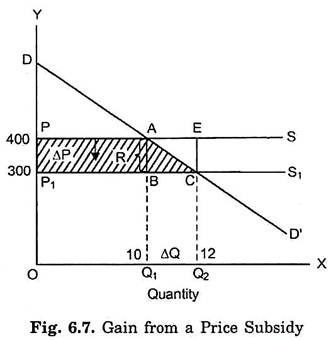
Consider Fig. 6.7 where DD is the demand curve for food-grains which, as explained above, can also be interpreted as marginal utility (or marginal valuation) curve. To begin with, PS is the supply curve, assuming constant cost conditions. Price determined is OP or Rs. 400 per quintal. With the grant of subsidy equal to Rs. 100 per quintal, supply curve shifts below to P1S1 and as a result price falls to OP1 or Rs. 300 per quintal.
With the reduction in price to OP, (i.e., Rs. 300 per quintal) quantity demanded increases from OQ1 to OQ2. It will be seen from Fig. 6.7 that the total gain in consumer surplus is equal to the area PACP1 which can be divided into two parts, namely, the area PABP1 (= R.01) where R is the subsidy per quintal of food-grains plus triangle ABC, which equals 1/2 R.ΔQ.
Thus, the gain in consumer surplus R.Q1 + 1/2 2R.ΔQ.
where R.Q1 represents the reduction in expenditure on the quantity that would have cost Rs. R (= Rs. 100) per quintal more without subsidy. Thus R.Q1 represents the benefit or gain in consumer surplus to those who were purchasing food-grains before the grant of subsidy but would now do so at a lower price. The amount 1/2 R.ΔQ represents the gain in consumer surplus due to the increase in quantity demanded at a lower price made possible by the grant of subsidy. Thus, the total gain in consumer surplus is the area PACP1 which equals R.Q1 + 1/2 R.ΔQ.
ADVERTISEMENTS:
But the cost of subsidy to the Government is R.Q2 or the area PXPEC which is greater than the gain in consumer surplus by the area of the triangle ACE. Thus, if the buyers would have been given the lump sum grant of PACP1 they would have been as well off as in case of subsidy which costs more to the Government. Thus, subsidy causes excess burden equal to the area of triangle ACE as compared to the lump sum grant.
Application # 4. Use of Consumer Surplus in Cost-Benefit Analysis:
An important application of consumer surplus is its use in cost-benefit analysis, especially of public investment projects. In fact, Dupuit, the originator of the idea of consumer surplus in his paper “On the Measurement of Public Works” in 1944 used the concept of consumer surplus for describing the impact of public investment projects on social welfare. In recent years Prof. E.J. Mishan has based his cost-benefit analysis on consumer surplus approach.
Consumer’s surplus has been treated as benefits in various cost-benefits analysis of investment projects. The cost-benefit analysis has become very popular these days to judge the desirability of public investment in particular projects. It should be noted that costs and benefits in cost-benefit analysis do not merely mean money costs and money benefits but real costs and real benefits in terms of satisfaction and resources.
Further, cost-benefit analysis looks at costs and benefits from social point of view; it is concerned with social benefits and social costs. The amount of consumer’s surplus expected to be derived from certain projects such as a bridge; road, park, dam etc. are considered as an important benefit flowing from these projects.
The benefit of a new motor way or flyover is estimated by reference to the expected savings of time and cost of fuel by all motorists who will make use of the new road or flyover. The concept of cost-saving however, as we shall see below, is derived directly from the concept of consumer’s surplus.
Thus, prior to the introduction of the new flyover in question, the consumer’s surplus from using this particular route is the triangle under the relevant demand curve which measures the maximum sum motorists are willing to pay above the amount they currently spend on the journey.
ADVERTISEMENTS:
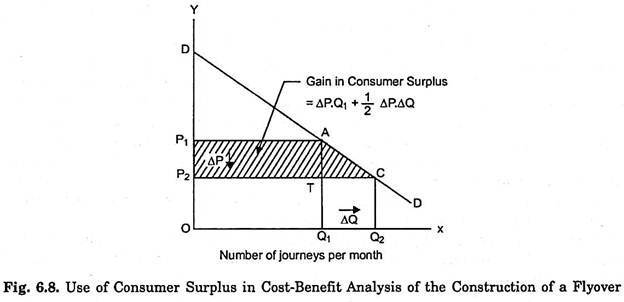
How the concept of consumer surplus is used in cost-benefit analysis of public investment, say the construction of a flyover is illustrated in Fig. 6.8 where on the X-axis we measure the number of journeys made per month on a particular route where flyover is proposed to be undertaken and on the Y-axis we measure the price or cost per journey.
DD is the demand curve for the journey on that route which, shows the maximum price the motorists are willing to pay for making journeys on that route. If the current price or cost per journey, that is, prior to the construction of flyover is OP1; the motorists make OQ1 number of journeys on that route and pay OP1. OQ1 as the total cost for the OQ, journeys made.
It will be seen from the demand curve that the total amount of money that the motorists will be willing to pay for OQ1 journeys equals the area ODAQ1 and thus the triangle P1DA represents the consumer surplus they derive from making OQ1 journeys. Now suppose the flyover is constructed which by reducing their fuel consumption reduces the cost per journey to OP2. At the lower price or cost per journey, they will make OQ2 number of journeys and their consumer surplus will increase by the shaded area P1ACP2. This is the benefit the motorists receive from the construction of flyover.
This increase in consumer surplus can be divided into two parts. First, we have the cost saving component equal to the rectangular area P1P2TA which is calculated as the saving per journey multiplied by the original number of journeys OQ1. The other part of the increase in consumer surplus is represented by the area of the triangle ATC which is the gain in consumer’s surplus obtained from the additional journeys made by the same motorists or the new ones.
It is worth noting that it is the cost-saving segment of the increment in consumer surplus that often enters into the cost-benefit calculations of the investment projects. But, as we have just seen, this cost-saving is the main component of the addition to the consumer surplus due to fall in the cost per journey brought about by the construction of the flyover.
The concept of consumer’s surplus in the context of an individual and in the context of a particular good is a meaningful and useful idea. However, it is worth noting here that the use of the concept of consumer’s surplus as a tool for formulation of policies such as choice of investment projects based on cost-benefit calculation requires the summation of consumer’s surpluses derived from a good or project by various consumers belonging to different income groups.
ADVERTISEMENTS:
Such summation and comparison of consumer’s surplus of different individuals can be validly made if one rupee worth of consumer’s surplus means the same thing to different individuals. However, this is based on the assumption that marginal utility of money is the same for all individuals regardless of the size of their income. This lands us into interpersonal comparison of the utility which is not regarded as scientific and justified by many economists.


