In the modern free-market economy, the process of capital formation consists of the following three stages:
1. An increase in the rate of real savings so that resources that would have been devoted to the production of consumption goods should be released for the purpose of capital formation.
2. Existence of a good financial system so that the available resources are obtained by private investors for capital formation.
3. The act of investment itself so that resources are actually used for the production of capital goods.
ADVERTISEMENTS:
1. Rate of Saving:
Savings in India are classified into three groups:
i. Household Savings;
ii. Corporate Savings; and
ADVERTISEMENTS:
iii. Government Savings.
We discuss below these categories of savings and the factors determining them:
i. Household Savings:
Household savings comprise savings of all households and individuals, both rural and urban, and non-corporate business undertakings, partnerships and non-profitable institutions like charitable trusts. Households save when they do not spend all their incomes on consumer goods. When individuals or households save, they release resources from the production of consumer goods. Resources (workers, capital, natural resources, materials, etc.) thus released are made available for the production of capital goods.
ADVERTISEMENTS:
The level of savings in a country depends upon the power to save and the will to save. The savings of the households are either in the form of financial assets like bank deposits, shares, bonds, provident fund, life insurance policies, national saving certificates etc, or in the form of physical assets such as various capital goods, houses, etc.
Level of Per Capita Income and Distribution of Income:
The power to save or saving capacity of an economy mainly depends upon the level of per capita income and the distribution of national income. The greater the level of per capita income, the greater will be the amount of savings. The countries having higher levels of per capita income can save more than those with low levels of income. That is why the rate of savings in U.S.A. and Western European countries is much higher than that in developing and poor countries like India. Further, the greater the inequalities of income, the greater will be the amount of savings in the economy. If the national income is equally distributed, much of the income will be consumed and a little would be saved. On the contrary, if national income is unequally distributed, a larger amount of savings will be done by richer people.
Apart from the power to save, the total amount of savings depends upon the will to save. Various personal, family, or national considerations induce the people to save. People save in order to provide against old age and unforeseen contingencies. Some people desire to save a large sum to start their own business or to expand the existing business. Moreover, people want to make provision for education, marriages and a good start in business for their children.
Rate of Inflation:
Another important factor which determines the household saving in the country is the price situation. In the economy when there is high inflation rate or prices are continuously rising, value of money declines. The rise in prices or the fall in the value of money has an adverse effect on the savings in the economy. When the value of money is declining every year due to the rise in prices, it is not profitable to save money and, therefore, propensity to save diminishes. Besides, inflation or rise in prices reduces the capacity to save of the people because a greater part of income has to be spent on essential consumption due to the rise in prices.
Growth Rate of Per Capita Income:
In addition to the current level of per capita income, growth rate of per capita income as emphasised by life cycle theory of consumption and saving is also an important determinant of household saving. If income per capita is not growing, the task of raising the marginal rate of saving is likely to be difficult because more saving in this case has to be achieved by curtailing present consumption. If per capita income is rising due to increase in productivity, it becomes possible to save relatively more out of increment in income and thereby rate of saving can be increased while increasing absolute consumption at the same time.
It is noteworthy that the growth in per capita income can occur if investment in physical capital and human capital or its productivity increases. A higher rate of saving ensures higher rate of investment and thereby generates higher growth in per capita income. But the reverse is also true; a higher growth rate in per capita makes it possible to raise the rate of saving by keeping marginal rate of saving higher than average rate of saving.
ADVERTISEMENTS:
Policies to Restrain Growth in Consumption:
To increase the rate of saving deliberate policies to restrain the growth of consumption have also been adopted. For example, in India prior to mid -1980s industrial licensing was actively used to ensure that there was no more investment in luxury durable consumer goods likes automobiles, colour TVs, air conditioners, refrigerators except in small scale sectors and existing factories.
Heavy excise duties were levied on consumer goods, especially durable ones, to discourage their production. Besides, to restrain the consumption of durable consumer goods heavy tariffs were levied on imports of such goods or imports of such goods were prohibited. It may however be noted that policies of using physical controls and detailed industrial licensing obstructed the rate of industrial growth. Therefore, in India in the beginning of the Sixth Plan (1980-85) output projections for the plan periods were based on consumption requirements of the people and physical controls on the production and consumption of goods were liberalised to step up economic growth.
Interest Rate Policy:
ADVERTISEMENTS:
To promote savings, policy of following positive real interest rate has been suggested by several economists. Positive real rate of interest has been suggested for raising household savings. Real rate of interest rate is nominal rate of interest rate minus rate of inflation. Advocates of the policy of real rate of interest argue that negative real interest rate will divert savings to informal financial markets, unproductive investment (such as gold, jewellery, luxurious houses) and will cause flight of capital from the country.
Therefore, for promoting savings nominal rate of interest should be kept above rate of inflation. Positive real rate of interest also ensures efficient utilisation of resources, particularly scarce capital. Though rise in positive real rate of interest causes the financial savings to increase, the.re is no firm evidence about its positive effect on the increase in overall savings of the economy.
ii. Public Savings:
Public Savings are another source of savings. In Government savings are included the surplus of revenue obtained through taxes and surpluses from public undertakings over and above the current expenditure of the Government. Given the current consumption expenditure of the Government, the greater the revenue collected from taxes and the profits earned from public enterprises, the greater the Government or public savings.
ADVERTISEMENTS:
It is worth noting that all revenue earned from taxes, etc. does not constitute the public savings because a good part of the tax revenue is spent on current consumption expenditure of the Government such as civil administration, defence and other unproductive services. That part of income or revenue of the Government which is over and above the expenditure on civil administration, defence and other current consumption is called the public savings. The Government savings are used for public investment spending on building of factories, roads, irrigation facilities, and other various types of industries started by the Government.
In India public savings of both Centre and State governments was around 2.9 per cent of GDP at market price in 1970-71, it reached its peak of 4.9 per cent of GDP in 1976-77 and started declining thereafter and in 1989-90, it fell to 1.6 per cent of G.D.P. The decline in budgetary savings of government as distinguished from those of public enterprises was relatively much higher. It is noteworthy that trends in fiscal deficit determine the performance in public savings.
Table 7.1 shows that public savings increased to 2.0 per cent of GDP in 1995-96, the year in which revenue deficit was at the lowest mark in the nineties. Subsequently, with the increase in revenue deficit, public savings declined and even became negative. Had the household savings not increased during this period, this would have led to the decline in gross domestic saving (GDS) and would have adversely affected investment and economic growth in the economy.
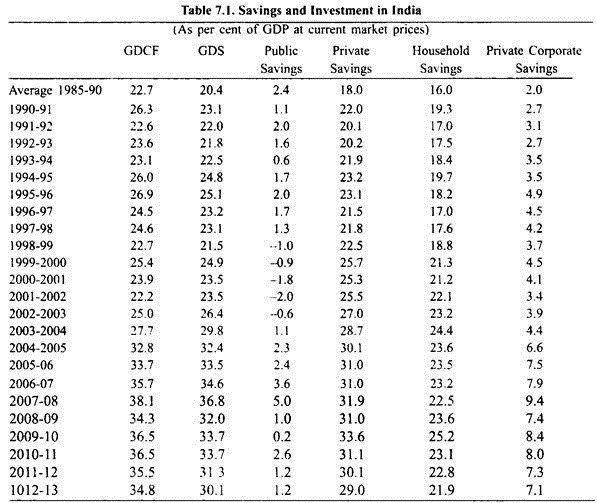
However, after 2003-04 there was appreciable increase in public saving as will be seen from Table 7.1. Rate of public saving as per cent of GDP which was -0.6% in 2002-03 became positive after it. In 2003-04 it was 1.1 per cent which went on increasing and in 2007-08 it was at peak of 5 per cent of GDP. This accounts for large increase in overall gross domestic saving (GDS) and Gross Domestic Capital Formation (GDCF).
On account of this large increase in gross domestic saving and capital formation rate of growth of GDP rose above 9 per cent in three successive years, 2005-08, and the Indian economy became the second highest growing economy of the world. It is worth noting that to prevent global financial crisis (2008-09) from causing drastic decline in economic growth, the Indian Government reduced its several taxes and increased its expenditure to provide fiscal stimulus to the Indian economy. As a result, revenue deficit increased and public saving drastically declined to 1.0 per cent of GDP in 2008-09, 0.2 per cent in 2009-10 but rose to 2.6% in 2010-11.
ADVERTISEMENTS:
The huge combined fiscal deficit of the Centre and the States which presently constitutes about 10 per cent of Gross Domestic Product is adversely affecting saving and investment in the economy and therefore the rate of economic growth of the Indian economy. To quote Shankar Acharya, a former economic advisor to the Ministry of Finance, “It is quite interesting how the deterioration of about 3 per cent points of GDP in the consolidated revenue deficit between 1995-96 and 1998-99 is reflected strongly in the worsening of aggregate saving and investment ratios over the period. It would be hard to find more telling evidence of the adverse impact of fiscal deficit on savings and investment. Another way to look at this is that if the fiscal deficit deterioration since 1995-96 had not occurred, saving and investment might well have been higher by around 3 per cent points of GDP in recent years.”
The above analysis underlines the importance of measures to reduce fiscal deficit, particularly revenue deficit, if rate of saving and investment in the Indian economy is to be raised to accelerate the rate of economic growth. For this purpose base of taxation must be widened by withdrawing the several exemptions in income and wealth taxes as suggested by various committees.
Besides, the subsidies must be well targeted so that only the poor should take advantage of them and the remaining subsidies must be phased out. Further, to reduce revenue deficit, non-plan non-essential government expenditure must be reduced along with the reforms in the taxation system. However, care should be taken to avoid any cut in Government expenditure on education and health which promote accumulation of human capital and have beneficial effect on economic growth.
It may be pointed out that savings may be either voluntary or forced. Voluntary savings are those which people make of their own free will. As explained above, voluntary savings depend upon the power to save and will to save of the people. On the other hand, taxes by the Government represent forced savings.
iii. Private Corporate Sector Savings:
Furthermore, savings may be done not only by households and Government but also by corporate business enterprises corporate business enterprises save when they do not distribute whole of their profits but retain a part of them in the form of undistributed profits. They then use these undistributed profits for investment in real capital. In advanced countries like U.S.A. and England, these corporate savings form the largest part of the total savings. In U.S.A. and England, corporate savings, i.e., undistributed profits constitute about 50% to 60% of the total annual domestic savings. Note that savings of unincorporated business enterprises are included in household savings. Business savings of private corporate sector in India are shown separately in Table 7.1.
ADVERTISEMENTS:
It will be seen from this table that the private corporate sector, which operates in the organised sector, though contribute significantly to Gross National Product, their saving makes only a small contribution to gross domestic savings. The corporate sector savings which contributed on an annual average of 2.0 per cent of GDP to gross domestic saving in 1990-91 reached its peak in 1995-96 when their savings constituted 4.9 per cent of GDP.
Thereafter it declined to 3.4 per cent of GDP in 2001-02 and to 3.9 per cent in 2002-03. The lower corporate saving was attributed to high rental cost of capital (including high real rate of interest), high corporate tax rate, high rates of excise duties, tax on dividend distribution, inefficiency in use of investment funds and underutilisation of production capacity. Liberalisation regime initiated in India since 1991 providing for reduction in tariff rates on imported raw materials, reduction in corporate tax, and excise duties resulted in higher corporate saving in 1995-96 and 1997-98. Recently, lowering of lending interest rates as a result of soft interest rate policy also boosted the profits of corporate sector and therefore since 2002-2003 corporate saving has tended to rise (Table 7.1).
Corporate sector saving rose from 4.4% of GDP in 2003-04 to 6.6% in 2004-05, to 7.5% in 2005-06 and 7.9% in 2006-07 and further rose to 9.4% in 2007-08. The global financial crisis in 2008-09 affected the saving of the corporate sector which declined to 7.4 per cent in 2008-09, 8.4% per cent in 2009-10 and 8% in 2010-11.
2. Financial System:
Next step in the process of capital formation is that the savings of households must be mobilised and transferred to businessmen or entrepreneurs who require them for investment. In the capital market, funds are supplied by the individual investors (who may buy securities or shares issued by the companies). Banks, investment trusts, life insurance companies, finance corporations, are other financial institutions which mobilise savings for investment purposes.
In India there is also unorganised capital market constituting indigenous bankers and money-lenders. One reason responsible for the low rate of capital formation in India has been the absence of well-developed capital market. Indian capital is said to be very shy. If the rate of capital formation in the private sector is to be stepped up, the development of financial system is very necessary. Well-developed financial market will ensure that the savings of the society will be mobilised and transferred to the entrepreneurs or businessmen who require them for investment.
ADVERTISEMENTS:
3. Investment:
For savings to result in capital formation and economic growth they must be invested. In order that investment of savings should take place, there must be a good number of honest and dynamic entrepreneurs in a country who are willing to take risks and bear uncertainty of production. Given that a country has got enough good and venturesome entrepreneurs, investment will be made by them only if there is sufficient inducement to invest. Inducement to invest depends on marginal efficiency of capital, i.e., rate of return or profit on the one hand, and real rate of interest on the other.
If prospects about profit are quite bright, that is, when entrepreneurs expect large profits from investment, investment will be made on a large scale. If profits are expected to be low, investment made will also be small. It is generally believed that at a lower real rate of interest, investment is more and at a higher real rate of interest, investment is less. In other words, it means that when credit is cheaper, businessmen will borrow more funds for investment purposes.
Of the two determinants of inducement to investment, namely, marginal efficiency of capital and the rate of interest, it is the former which is of greater importance. Marginal efficiency of capital depends upon the cost or supply price of capital as well as the expectations of profits. Fluctuations in investment are mainly due to the changes in expectations regarding profits. But it is the size of market (i.e., demand for goods) which determines the scope for profitable investment.
Thus primary factor which determines the level of investment or capital formation in an economy is the size of market for goods. Demand for capital equipment like machinery depends upon the demand for goods it helps to produce. The inducement to invest is limited by the size of the market i.e. the demand for the goods. The greater the size of the market, the greater will be the inducement to invest. The small size of the market will discourage the entrepreneurs to make investment. All poor countries have a small market in everything and this is a great hurdle in the way of capital formation in underdeveloped countries.
Animal Spirits and Investment:
ADVERTISEMENTS:
J.M. Keynes who emphasised that marginal efficiency of capital played a crucial role in determining investment also laid stress on animal spirits of entrepreneurs for causing fluctuations in investment. By animal spirits Keynes means the waves of optimism and pessimism which quite often grip business class and greatly affect their investment behaviour. Keynes attributed the drastic fall in private investment in 1929-33 to the collapse of marginal efficiency of capital which was caused by wave of pessimism among the business class which resulted in stock market crash in England. Even in India today lack of confidence among business class resulting from their animal spirits is responsible for slowdown in private investment since 1997.
Public Investment in Infrastructure:
Private investment is also affected by the availability of infrastructure such as power, good roads and means of transport, good means of communication, good ports, etc. Slowdown in the Indian economy since 1996-97 is also partly due to lack of good infrastructure. It has therefore been suggested that public investment in infrastructure not only generates demand for the industrial products but also leads to the expansion of infrastructural facilities such as power, ports, roads etc. Thus, in the Indian context public investment helps to solve both the supply-side and demand-side problems of private sector investment. Therefore, in India the greater public investment crowds in private investment rather than crowding it out.
Taxation Policies:
Taxation policies of the Government also affect investment behaviour of the corporate sector. High corporate taxes discourage private investment. For example, high corporation income tax, tax on dividend distribution, high excise duties and tariffs adversely affect corporate sector investment by lowering the profitability of investment. Therefore, to increase corporate investment, investment –friendly taxation policies need to be adopted.
Availability of Credit:
Apart from internal savings, the corporate sector gets investment funds from the capital market and banks. To meet their needs for working capital they rely on bank credit. Therefore, to ensure greater private investment adequate credit facilities must be made available.
Improvement of Stock Market:
Besides, corporate sector raises its equity capital from the stock market. Therefore, the working of stock markets must be improved and made fair and transparent, so that public should have confidence in fair dealings at the stock market. For instance, stock market crash in 1992 engineered by Harshad Mehta and later by Ketan Parikh and scams involving UTI has badly shaken the confidence of small investors who have withdrawn from the market. This has created difficulties for private corporate sector for raising investment funds from the stock market through issue of equity capital.
Size of Market or Level of Demand:
Ragnar Nurkse in his now well-known work, ‘Problems of Capital Formation in Underdeveloped Countries’ emphasized size of market (that is, level of demand) for a commodity is an important determinant of capital formation in developing countries. Furthermore, according to him, size of market for a commodity is determined by levels of incomes of the people.
Since the production of industrial commodities in the modern times requires installation of machinery and other capital equipment which have large productive capacity. Therefore, making investment in them to be profitable there should be sufficient size of market or demand for that industrial commodity.
According to Nurkse, since because of poverty in underdeveloped countries per capital income of the people are low, there will not be enough demand for an industrial product and as a result productive capacity created will remain underutilised. Therefore, it will not be profitable to make investment in the machinery and other capital equipment for the production of the commodity.
Thus limited size of the market in underdeveloped countries lowers inducement to invest in them to overcome this problem of limited size of the market for commodities. Nurkse suggested ‘balanced growth strategy’ under which simultaneous investment in a large number of industries be made so that the workers employed in various industries create demand for each other’s product.
Saving, Capital Formation and Economic Growth in India:
In India also, capital formation or rate of investment has played a significant role in generating higher economic growth rate. The higher annual growth rate of 5.8 per cent per annum during the eighties was due to higher rate of investment or capital formation as compared to the earlier decades of planned development which witnessed only 3.5 per cent average growth rate per annum.
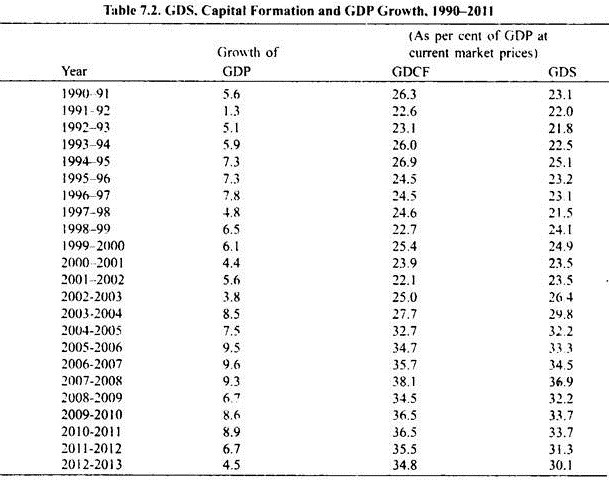
The 1900s represent a very important period in economic growth in India because far reaching economic reforms of liberalisation and privatisation were carried out during this period. As will be seen from Table 7.2, leaving the first two years as they represent the transition period of crisis and adjustment, in the post-reform period, the growth rate in 1992-93 to 1996-97 has been quite higher (6.6 per cent average annual growth rate) as compared to 5.8 per cent in the pre-reform period.
This was due to pick-up in corporate saving and investment following the abolition of industrial licensing and reduction in rental cost of capital due to reduction in tariffs on imports of raw materials, and reduction in corporate taxes which increased the profitability of private investment.
However, after 1996, higher growth rate could not be maintained and in fact Indian economy went into recession despite the continuation of economic reforms. Two factors were responsible for it. First, following the structural adjustment reforms and the need to contain fiscal deficit public investment declined between 1997-98 and 2002-03. This adversely affected the overall growth in GDP as well as the industrial growth through both adverse supply-side and demand-side factors.
It will be seen from Table 7.2 that between 1992-93 and 1996-97 higher average GDP growth rate of around 6.5 per cent per annum was achieved mainly due to higher rate of gross domestic capital formation (GDCF). In the late nineties and up till 2002-03 when investment or GDCF was less especially due to decline in public investment, growth rate of GDP also fell.
After 2003 when both public investment and private investment had picked up, growth rate of GDP rose to over 9 per cent per annum during the three years (2005-08). Now in the Eleventh Five Year (2007-12) period the average 8 per cent growth in GDP per annum was achieved.
This was considered feasible as gross domestic saving rate (GDS) had gone up to 36.4 per cent and gross domestic capital formation (GDCF) per annum in 2007-08. However, the impact of global financial crisis (2008-09) brought down the growth rate of GDP to 6.7% in 2008-09 and to 8.6% in 2009-10 and to 8.9% in 2010-11. However, for the reasons explained below, for 2011-12, estimate for GDP growth rate is lower at 6.7 per cent.