
The following points highlight the top ten managerial uses of break-even analysis. the managerial uses are: 1. Safety Margin 2. Target Profit 3. Change in Price 4. Change in Costs 5. Decision on Choice of Technique of Production 6. Make or Buy Decision 7. Plant Expansion Decisions 8. Plant Shut Down Decisions 9. Advertising and Promotion Mix Decisions 10. Decision Regarding Addition or Deletion of Product Line.
Use # 1. Safety Margin:
The break-even chart helps the management to know at a glance the profits generated at the various levels of sales. The safety margin refers to the extent to which the firm can afford a decline before it starts incurring losses.
The formula to determine the sales safety margin is:
Safety Margin = (Sales – BEP)/Sales x 100
ADVERTISEMENTS:
From the numerical example at the level of250 units of output and sales, the firm is earning profit, the safety margin can be found out by applying the formula
Safety Margin = 250 – 150/250 x 100 = 40%
This means that the firm which is now selling 250 units of the product can afford to decline sales upto 40 per cent. The margin of safety may be negative as well, if the firm is incurring any loss. In that case, the percentage tells the extent of sales that should be increased in order to reach the point where there will be no loss.
Use # 2. Target Profit:
The break-even analysis can be utilised for the purpose of calculating the volume of sales necessary to achieve a target profit.
ADVERTISEMENTS:
When a firm has some target profit, this analysis will help in finding out the extent of increase in sales by using the following formula:
Target Sales Volume = Fixed Cost + Target Profit/Contribution Margin Per Unit.
By way of illustration, we can take Table 1 given above. Suppose the firm fixes the profit as Rs. 100, then the volume of output and sales should be 250 units. Only at this level, it gets a profit of Rs. 100. By using the formula, the same result will be obtained.
Use # 3. Change in Price:
The management is often faced with a problem of whether to reduce prices or not. Before taking a decision on this question, the management will have to consider a profit. A reduction in price leads to a reduction in the contribution margin.
ADVERTISEMENTS:
This means that the volume of sales will have to be increased even to maintain the previous level of profit. The higher the reduction in the contribution margin, the higher is the increase in sales needed to ensure the previous profit.
The formula for determining the new volume of sales to maintain the same profit, given a reduction in price, will be
New Sales Volume = Total Fixed Cost + Total Profit/New Selling Price – Average Variable Cost
For example, suppose a firm has a fixed cost of Rs. 8,000 and the profit target is Rs.20,000. If the sales price is Rs.8 and the average variable cost is Rs. 4, then the total volume of sales should be 7,000 units on the basis of the formula given under target price.
Suppose the firm decides to reduce the selling price from Rs.8 to Rs. 7, then the new sales volume should be on the basis of the above formula:
New Sales Volume = 8,000 + 20,000/7-4.
= Rs. 9,330
From this, we can infer that by reducing the price from Rs. 8 to Rs. 7, the firm has to increase the sales from Rs. 7,000 to Rs 9,330 if it wants to maintain the target profit of Rs. 20,000. In the same way, the sales executive can calculate the new volume of sales if it increases the price.
Use # 4. Change in Costs:
When costs undergo change, the selling price and the quantity produced and sold also undergo changes.
ADVERTISEMENTS:
Changes in cost can be in two ways:
(i) Change in variable cost, and
(ii) Change in fixed cost.
(i) Variable Cost Change:
ADVERTISEMENTS:
An increase in variable costs leads to a reduction in the contribution margin. This reduction in the contribution margin will shift the break-even point downward. Conversely, with the fall in the proportion of variable costs, contribution margins increase and break-even point moves upwards.
Under conditions of changing variable costs, the formula to determine the new quantity or the new selling price are:
(a) New Quantity or Sales Volume = Contribution to Margin/Present Selling Price – New Variable Cost Per Unit
(b) New Selling Price = Present Sale Price + New Variable Cost-Present Variable Cost
ADVERTISEMENTS:
Example:
The contribution margin is Rs. 64,000, the present sale price is Rs.10 and the present variable cost is Rs.6. If the variable cost per unit goes up from Rs.6 to Rs. 7, what will be the new sales volume and price?
New Sales Volume = 64,000 /10-7 = 64,000 /3 = 21,300 units
New Sales Price = (10+7-6) = Rs.11.
(ii) Fixed Cost Change:
An increase in fixed cost of a firm may be caused either due to a tax on assets or due to an increase in remuneration of management, etc. It will increase the contribution margin and thus push the break-even point upwards. Again to maintain the earlier level of profits, a new level of sales volume or new price has to be found out.
ADVERTISEMENTS:
New Sales Volume = Present Sale Volume + (New Fixed Cost + Present Fixed Costs)/(Present Selling Price-Present Variable Cost)
New Sale Price = Present Sale Price + (New Fixed Costs – Present Fixed Costs)/Present Sale Volume
Example:
The fixed cost of a firm increases from Rs. 5,000 to Rs. 6,000. The variable cost is Rs. 5 and the sale price is Rs. 10 and the firm sells 1,000 units of the product
New Sales Volume = 1,000 + 6,000 – 5,000/10-5=1,000+1,000/5 = 1,000+200 = 1,200 units
New Sale Price =10 + 6,000-5,000/1,000 = 10 + 1,000/1,000 = Rs.10 + Re 1
ADVERTISEMENTS:
= Rs. 11
Use # 5. Decision on Choice of Technique of Production:
A firm has to decide about the most economical production process both at the planning and expansion stages. There are many techniques available to produce a product. These techniques will differ in terms of capacity and costs.
The breakeven analysis is the most simple and helpful in the case of decision on a choice of technique of production. For example, for low levels of output, some conventional methods may be most probable as they require minimum fixed cost.
For high levels of output, only automatic machines may be most profitable. By showing the cost of different alternative techniques at different levels of output, the break-even analysis helps the decision of the choice among these techniques.
Use # 6. Make or Buy Decision:
Firms often have the option of making certain components or for purchasing them from outside the concern. Break-even analysis can enable the firm to decide whether to make or buy.
Example:
ADVERTISEMENTS:
A manufacturer of car buys a certain components at Rs. 20 each. In case he makes it himself, his fixed and variable cost would be Rs. 24,000 and Rs.8 per component respectively.
BEP = Fixed Cost/Purchase Price – Variable Cost
=24,000/20-8 = 24,000/12 = 2,000 units
From this, we can infer that the manufacturer can produce the parts himself if he needs more than 2,000 units per year.
However, certain considerations need to be taken account of in a buying decision, such as:
(i) Is the required quality of the product available?
ADVERTISEMENTS:
(ii) Is the supply from the market certain and timely?
(iii) Do the supplies of the components try to take any monopoly advantage?
Use # 7. Plant Expansion Decisions:
The break-even analysis may be adopted to reveal the effect of an actual or proposed change in operation condition. This may be illustrated by showing the impact of a proposed plant on expansion on costs, volume and profits. Through the break-even analysis, it would be possible to examine the various implications of this proposal.
Example:
A company has the capacity to produce goods worth of Rs. 40 crores a year. For this, it has incurred a fixed cost of Rs. 20 crores, the variable costs being 60% of the sales revenue.
Now the company is planning to incur an additional Rs. 6 crores in fixed costs to expand its production capacity from Rs. 40 crores to Rs.60 crores. The survey shows that the firm’s sales can be increased from Rs. 40 crores to Rs. 50 crores. Should the firm go in for expansion?
BEP at present capacity = Fixed Cost/Margin Contribution %
= Rs. 10 crores/40% = Rs. 25 Crores
BEP at the proposed capacity = Rs. 16 crores/40% = Rs. 40 Crores
Increase in break-even point = Rs 40 crores-Rs. 25 crores
= Rs. 15 crores.
Thus we can infer that the firm should go in for expansion only if its sales expand by more than Rs. 15 crores from its earlier level of Rs. 40 crores.
Use # 8. Plant Shut Down Decisions:
In the shut-down decisions, a distinction should be made between out of pocket and sunk costs. Out of pocket costs include all the variable costs plus the fixed cost which do not vary with output. Sunk fixed costs are the expenditures previously made but from which benefits still remain to be obtained e.g., depreciation.
Use # 9. Advertising and Promotion Mix Decisions:
The main objective of advertisement is to stimulate or increase sales to all customers—former, present and future. If there is keen competition, the firm has to undertake vigorous campaign of advertisement. The management has to examine those marketing activities that stimulate consumer purchasing and dealer effectiveness.
The break-even point concept helps the management to know about the circumstances. It enables him not only to take appropriate decision but by showing how these additional fixed cost would influence BEPs. The advertisement cost pushes up the total cost curve by the amount of advertisement expenditure.
Use # 10. Decision Regarding Addition or Deletion of Product Line:
If a product has outlived its utility in the market immediately, the production must be abandoned by the management and examined what would be its consequent effect on revenue and cost. Alternatively, the management may like to add a product to its existing product line because it expects the product as a potential profit spinner. The break-even analysis helps in such a decision.
Example:
A fan manufacturer possesses the following data regarding his firm:
Total Fixed Cost = Rs. 1,50,000
Volume of Sales = 5,00,000 units
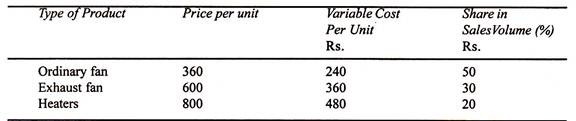
The manufacturer is considering whether or not to drop heaters from its product line and replace it with a fancy kind of fan.
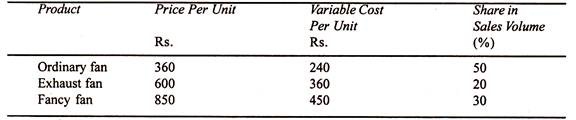
He knows that if he takes the decision of dropping heaters and replaces it with fancy fans his output and cost data would be:
To find out the impact of proposed change, we need to compare profits in the two situations. Firstly, we have to find out the contribution ratio of each product.
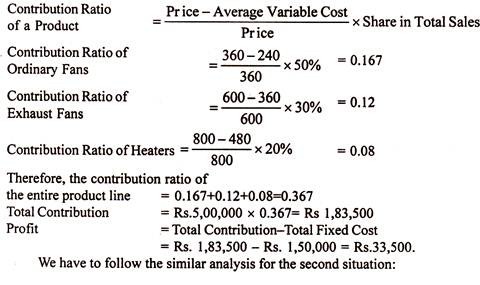
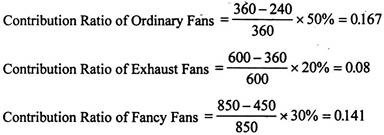
Thus the contribution ratio of the entire product line = 0.167 + 0.08 + 0.141 = 0.388.
Total Contribution = Rs. 5,00,000 x 0.388 = Rs. 1,94,000
Profit = Rs. 1,94,000 – Rs.1,50,000 = Rs 44,000
From the above analysis, we can infer that the manufacturer should drop heaters from his product line and add fancy fans to his product line so as to earn more profit.