
In this article we will discuss about:- 1. Meaning of Break-Even Point 2. Determination of Break-Even Point 3. Types.
Meaning of Break-Even Point:
The break-even point may be defined as that level of sales in which total revenues equal total costs and net income is equal to zero. This is also known as no-profit no-loss point. This concept has been proved highly useful to the company executives in profit forecasting and planning and also in examining the effect of alternative business management decisions.
The break-even point (B.E.P.) of a firm can be found out in two ways. It may be determined in terms of physical units, i.e., volume of output or it may be determined in terms of money value, i.e., value of sales.
BEP in terms of Physical Units:
ADVERTISEMENTS:
This method is convenient for a firm producing a product. The BEP is the number of units of a product that should be sold to earn enough revenue just to cover all the expenses of production, both fixed and variable. The firm does not earn any profit, nor does it incur any loss. It is the meeting point of total revenue and total cost curve of the firm.
The break-even point is illustrated by means of Table 1:

Some assumptions are made in illustrating the BEP. The price of the commodity is kept constant at Rs. 4 per unit, i.e., perfect competition is assumed. Therefore, the total revenue is increasing proportionately to the output. All the units of the output are sold out. The total fixed cost is kept constant at Rs. 150 at all levels of output.
ADVERTISEMENTS:
The total variable cost is assumed to be increasing by a given amount throughout. From the Table we can see that when the output is zero, the firm incurs only fixed cost. When the output is 50, the total cost is Rs. 300. The total revenue is Rs. 200.
The firm incurs a loss of Rs. 100. Similarly when the output is 100 the firm incurs a loss of Rs. 50. At the level of output 150 units, the total revenue is equal to the total cost. At this level, the firm is working at a point where there is no profit or loss. From the level of output of 200, the firm is making profit.
Break-Even Chart:
Break-Even charts are being used in recent years by the managerial economists, company executives and government agencies in order to find out the break-even point.
ADVERTISEMENTS:
In the break-even charts, the concepts like total fixed cost, total variable cost, and the total cost and total revenue are shown separately. The break even chart shows the extent of profit or loss to the firm at different levels of activity. The following Fig. 1 illustrates the typical break-even chart.

In this diagram output is shown on the horizontal axis and costs and revenue on vertical axis. Total revenue (TR) curve is shown as linear, as it is assumed that the price is constant, irrespective of the output. This assumption is appropriate only if the firm is operating under perfectly competitive conditions.
Linearity of the total cost (TC) curve results from the assumption of constant variable cost. It should also be noted that the TR curve is drawn as a straight line through the origin (i.e., every unit of the output contributes a constant amount to total revenue), while the TC curve is a straight line originating from the vertical axis because total cost comprises constant/fixed cost plus variable cost which rise linearly. In the figure, B is the break-even point at OQ level of output.
In the preparation of the break-even chart we have to take the following considerations:
(a) Selection of the approach,
(b) Output measurement,
(c) Total cost curve,
(d) Total revenue curve,
ADVERTISEMENTS:
(e) Break-even point, and
(f) Margin of safety.
Determination of Break-Even Point:
The formula for calculating the break-even point is
BEF = Total Fixed Cost/Contribution Margin Per Unit
ADVERTISEMENTS:
Contribution margin per unit can be found out by deducting the average variable cost from the selling price. So the formula will be
BEP = Total Fixed Cost/Selling Price – AVC
Example:
Suppose the fixed cost of a factory in Rs. 10,000, the selling price is Rs. 4 and the average variable cost is Rs. 2, so the break-even point would be
ADVERTISEMENTS:
BEP = 10,000/(4 – 2) = 5,000 units
It means if the company makes the sales of 5,000 units, it would make neither loss nor profit. This can be seen in the analysis.
Sales = Rs.20,000
Cost of goods sold:
(a) Variable cost at Rs.2 = Rs. 10,000
(b) Fixed costs = Rs. 10,000
ADVERTISEMENTS:
Total Cost = Rs. 20,000
Net Profit = Nil
BEP in term of Sales Value:
Multi-product firms are not in a position to measure the break-even point in terms of any common unit of product. They find it convenient to determine the break-even point in terms of total rupee sales. Here again the break-even point would be where the contribution margin (sales value—variable costs) would be equal to fixed costs. The contribution margin, however, is expressed as a ratio to sales.
The formula for calculating the break-even point is
BEP = Fixed Cost/Contribution Ratio
ADVERTISEMENTS:
Contribution Ratio (CR) = Total Revenue (TR) – Total Variable Cost (TVC)/Total Revenue (TR)
For example, if TR is Rs. 600 and TVC is Rs. 450, then the contribution ratio is
CR = 600-450/600 = 150/600 = 0.25
The Contribution Ratio is 0.25
BEP = Total Fixed Cost/Contribution Ratio
= 150/0.25 = 600
ADVERTISEMENTS:
The firm achieves its BEP when its sales are Rs. 600
Total Revenue = Rs.600
Total Cost = Rs.600
Net Profit/loss = Nil
Types of Break-Even Point:
The above paragraph explains a simple type of break-even point which is based on cost and revenue i.e., the profit and loss break-even.
There are two other types of break-even and they are:
ADVERTISEMENTS:
(i) Cash break-even, and
(ii) Income break-even.
(i) The Cash Break-Even:
An industry requires money for two purposes i.e., to acquire capital assets and to meet working capital requirements. These requirements can be partly met by his own investment and partly by loans and advances from financial institutions. The industry requires term loans to acquire capital assets like land and building, plant and machinery.
In the case of term loans, the financial institutions shall have to find out the probability of the applicant being able to meet the interest and loan repayment schedule. It will be more interested in knowing the level of break-even point where not only total costs are required but also the full debt service.
The level of break-even is called the cash break-even. It is based on revenue and cost data involving cash flows. The depreciation, investment allowance reserve and other provision of the cost items should be excluded but at the same time the repayment of instalments should be added to fixed cost.
Cash Break-Even Point = Fixed Cost + Loan installment – Cash outflow/Contribution per unit
(ii) The Income Break-Even:
The various sources from which the industry is proposed to be financed such as the capital, long term borrowing, deferred payments and other sources. If these sources are inadequate the industry may approach the bank for under writing its shares. If the share market does not respond positively, the equity risk falls on the underwriter.
As the share-holder of the bank will expect a certain dividend just to cover the payment of interest for the term loans. In order to calculate income break-even point the equity capital cash earnings should be added. The income breakeven point can be calculated in the following manner.
Income Break-Even Point = Fixed Cost + Earnings required for dividend/Contribution per unit
Multiple-product Firms and Break-Even Point:
The multiple products may differ in models, styles or sizes of their output. In the case of multi-product firms the break-even point for each product can be calculated if the ‘product mix’ is known. The product mix is the full list of products offered for sale by a company. It may range from one or two product lines to a combination of several product lines or groups.
Suppose an industry is engaged in the production of three items, namely X, Y, and Z. The contribution for items is as follows:
X = Rs. 6 per unit
Y = Rs. 4 per unit
Z = Rs. 2 per unit
The product-mix given by the manufacturer is as follows:
X = 40,000 units
Y = 2,00,000 units
Z = 1,60,000 units.
Then the product-mix proportions are 1:5:4. We can work out the weighted average contribution in the following way:
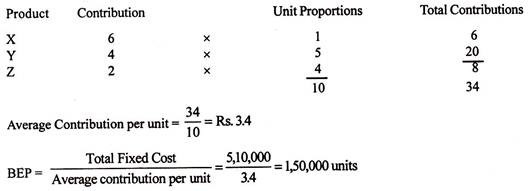
We will get the break-even output for all the three items by dividing the above figure in the same proportion:
X = 15,000
Y = 75,000
Z = 60,000
This reveals that the production manager has to ensure that production in the X line does not go below 15,000 units, in the Y line 75,000 units and in the Z line 60,000 units. If not, he has to sustain loss. The same method can be applied for computing the BEP in cases of multiple product industries producing any number of items.