In this article we will discuss about break-even analysis’s chart.
The break-even point represents the volume of sales at which revenues equal expenses — that is, at which profit is zero. The break-even volume is calculated at by dividing fixed cost (costs that do not vary with output) by the contribution margin per unit, that is, selling price minus variable costs (costs that vary directly with output).
In certain situations and especially in the consideration of multiproduct, break-even volume is measured in terms of sales value (in rupees) rather than units. This is done by dividing total fixed cost by contribution margin ratio (contribution margin divided by selling price). Often, in such computation, the desired profit is added to the fixed costs in the numerator in order to ascertain the sales volume necessary for producing the target profit.
Break-Even Chart:
Other than as a rough indicator of the changes in volume which the company might experience before suffering losses or making profit, the breakeven point is in itself of little relevance to managerial decision making. More broadly, however, break-even analysis refers to a crude initial evaluation of the impact on profits of small, short-run changes in volume, in fixed cost, and in the price per unit and variable cost.
ADVERTISEMENTS:
Typically, this is achieved by use of break-even charts or graphs which represent linear approximations of the economist’s curves for total cost and revenue. These linear approximations are drawn up by assuming both a given decision on output and input level and a given selling price. Thus, they are to be considered reasonable only within a narrow range around the given output; outside such a range, different break-even charts would be needed for profit evaluation.
The break-even chart allows management to visualise the sensitivity of profit to such contemplated policy changes as would affect the four operating variables (volume, fixed costs, product price, and average variable cost), or the sensitivity to errors in forecasting these variables. The indicated sensitivity guides management with respect to the degree of care and effort required in analysing its plan or in refining its forecasts.
Break-Even Point:
Organisations usually aim at making a profit, where profit is defined as the difference between revenue and total cost:
Profit = revenue – total cost
ADVERTISEMENTS:
Most organisation sell a range of different products and it is important to know how much profit or loss each one makes. The break-even point gives answer to this question.
When a company sells a product for a fixed price, the revenue is found thus:
revenue = price per unit x number of units sold = PN
where
ADVERTISEMENTS:
P = price charged for unit
N = number of units sold
The costs associated with product are of two types — some are fixed regardless of the number of units made, while other vary with the output. If for example, a machine is leased to make a certain product, the cost of leasing may be fixed regardless of the number of units made, but the cost of raw materials may vary. Another example of this is the cost of purchase loan, road tax, insurance, and a variable cost for each mile travelled (petrol, oil, tyres, depreciation, etc.). So in general, we have:
Total cost = fixed cost + variable cost
= fixed cost + (cost per unit X number of units made)
= F + CN
Where
F = total fixed cost
C = cost per unit
ADVERTISEMENTS:
N = number of units made
Comparing the total cost of producing N units of a product with revenue generated from selling them leads to the important idea of a break-even point. This is the number of units that must be sold before a profit is made. Suppose a new product needs Rs 2,00,000 spent on research, development, tolling and other preparations before production can start.
During normal production each unit costs Rs 20 to make and is sold for Rs 30. The company will only start to make a profit when the original Rs 2,00,000 has been recovered. The point at which this happens is the break-even point. In this example each units sold contributes Rs 30 – Rs 20 = Rs 10 to the company, so 2,00,000/10 = 20,000 units must be sold to cover the original investment. After this point the excess of revenue over expenditure is profit.
The break-even point is defined as the point where:
ADVERTISEMENTS:
revenue = total cost
Or, price per unit x number of units sold
= fixed cost + cost per unit x number of units made
Assuming that all production is sold, we get:
ADVERTISEMENTS:
PN = F + CN
So
N (P -C) = F
Or
Break-even point
= N = F/P – C
ADVERTISEMENTS:
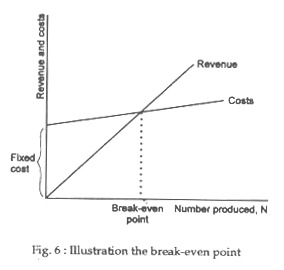
Both the revenue and total cost rise linearly with the number of units in Fig.6, we show the relationship graphically.
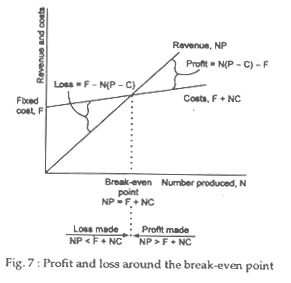
From Fig. 7 we see that:
If the number of units sold is higher than the break-even point, revenue is higher than costs and a profit is made:
Profit = N (P – C) – F
ADVERTISEMENTS:
If the number of units sold is equal to the break-even point, revenue equals total cost:
N (P – C) = F
If the number of units sold is less than the break-even quantity, costs are higher than revenue and a loss is made:
Loss = F – N (P – C)

