
This article attempts to explain economic inequality, particularly income inequality, and how it changes as economic development proceeds in a developing economy. Its discussion is divided into three parts. In the first part we explain the meaning and concept of economic inequality and the methods of its measurement. In the second part we critically examine the rationale for social acceptance of some degree of income inequality.
Also we will critically examine how much inequality is justified on the basis of incentives to work more, to acquire skills and education and to promote more saving for increasing the rate of economic growth.
Economic development means economic growth plus more desirable changes that must occur to raise the levels of living of the people at large.
These other desirable things for economic development to occur are:
ADVERTISEMENTS:
(1) Reduction in economic inequalities, both of income and wealth,
(2) Reduction of absolute poverty which is the extreme form of inequality and
(3) Reduction in unemployment and underemployment.
The economic development requires a faster and more inclusive growth in GDP. The basic issue in economic development is not only how to achieve faster growth in GDP but also who benefits from growth. The principal objective of developing countries, especially of India, is to raise the levels of living of the people of a country. Therefore, economic growth will be of little value if it benefits only a few rich, keeping a good number of the population in the state of poverty and unemployment.
ADVERTISEMENTS:
It has now been found that many developing countries have experienced relatively higher rates of economic growth but much of the benefits of growth have not reached to the bottom of around 33 to 40 per cent of population and as a result they remained poor.
It may be noted that prime cause of inequality is not so much due to the differences in earnings from work i.e. labour services but because of the highly skewed distribution of property or assets and also of the differential access of the people to such facilities as education, health, housing and employment.
Therefore, if the objective of economic equality is to be realised we have not only to improve the access of the people in general to the facilities of education, health, and housing but also to redistribute assets (for example, land reforms). Besides, to ensure relative equality, adequate employment opportunities are to be generated to ensure earnings from work to labourers.
Meaning of Income Inequality:
Economists are primarily concerned with these inter-related types of inequalities, namely, inequality in size distribution of- (a) income, (b) earnings from work (i.e. wages and salaries), and (c) wealth. Inequalities in earnings from work or labour services arise either from paid employment (i.e., wages and salaries) or earnings of individuals from self-employment in various types of economic activities.
ADVERTISEMENTS:
Inequalities in incomes are described with reference to households or families and refer to the amounts received by all members of a household from all sources and shared by all its members, both earners and non-earners (including dependants and children). In the discussion of income inequalities what matters is how much a person or household receives regardless of whether income received is solely from work, from wage employment or from other sources such as rent from land, interest on financial capital, profits from business or dividends from shares of corporate companies or gifts or from inherited wealth. That is, in the concept of income inequalities we are not concerned with functional distribution but with the size distribution of income.
Of course, functional distribution of income affects the size distribution of income. Incomes accrue to the households from the following three sources:
1. Income from work or earnings from labour services of the members of the family who are employed.
2. Income from wealth or assets possessed by a household or its individual members. The wealth consists of land and other non-renewable natural resources, tangible capital assets such as machines, equipment, buildings and financial assets belonging to households. Thus, rent from land, interest on financial capital and bank deposits and profits from enterprise and investment undertaken by the households or its members. Obviously, the distribution of income from wealth depends on distribution of wealth or assets among households in a society. The greater the inequality in the distribution of wealth or assets, the greater will be the inequality in income distribution.
3. The third source of income by households is the private or public transfer of income to the households as a result of unilateral income flows and cash transfers such as unemployment allowances, sickness benefits, old age pension, private transfers such as gifts, and remittances received from abroad by the households.
The income transfers from government also include free or subsidised supply of public services such as health and education to those who are incapable of funding them privately. It may be noted that transfer of income from government to individuals or households is essential in a welfare state and widely accepted as the function of the modern government in a democratic country.
Measurement of Income Inequality:
To measure income inequalities economists arrange all individuals or households by ascending order of personal incomes. Then total population of individuals or households is divided into quintiles (i.e., fifths) or deciles (i.e., tenths) from the bottom to the top income groups, that is, in ascending order of income levels.
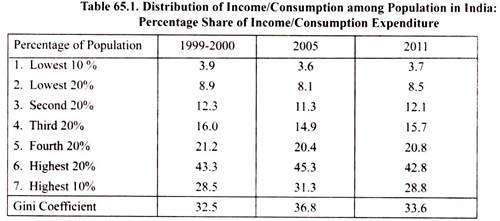
It is then determined what percentage or proportion of total national income accrues to different quintiles or deciles of households. To give a concrete illustration we give in Table 65.1 the distribution of national income of India according to the ascending order of household disposable income of India for the years 1999-2000, 2005 and 2011.
It will be observed from Table 65.1 that in the year 1999-2000 the top of 20 per cent of households in India had 43.3 per cent share of consumption expenditure, whereas bottom 20 per cent of population had only 8.9 per cent share of consumption expenditure in India. This shows the gross inequalities in consumption expenditure and therefore income distribution in the year 1999-2000.
ADVERTISEMENTS:
In the year 2005, household survey of consumption expenditure revealed that the highest (i.e., top) 20 per cent of the people had 45.3 per cent share of total consumption whereas the share of the lowest 20 per cent of population in consumption expenditure was only 8.1 per cent. This shows that between 1999-2000 and 2005 the inequality in consumption expenditure increased. This is also revealed by Gini Coefficient which was 36.8 in 2005 compared to 32.5 in 1999-2000.
Kuznets’ Ratio:
A popular method of measuring degree of income inequality is Kuznets’ ratio after the name of Simon Kuznets who has been a pioneer in the study of income inequality. Kuznets ratio is given by the income received by the top 20 per cent divided by the income of the bottom 40 per cent of the households or persons.
ADVERTISEMENTS:
In India as is seen from Table 65.1 that 1999-2000 top 20 per cent of households had 43.3 per cent share of national consumption expenditure and the bottom 40 per cent households 21.2 per cent of national consumption expenditure. This gives us Kuznets’ ratio to be equal to 43.3/21.2 = 2.04. Thus, the degree of consumption or income inequality in India in the year 1999-2000 as measured by Kuznets’ ratio was 2.04 which is quite high. In 2005, Kuznets’ ratio is 45.3/19.4 = 2.3 which is higher than in 1999-2000.
It is worth mentioning here that Kuznets’ ratio measures the degree of income inequality between the two extremes of very poor and very rich in the country. How is income distributed within the remaining range of income distribution is not considered by Kuznets’ ratio.
Kuznets’ Curve:
A very popular method of measuring income inequality is Kuznets’ Curve which graphically measures inequality in income distribution. In order to draw Lorenz Curve we have first to find out cumulative percentage of households corresponding to cumulative percentage of income accruing to them.
ADVERTISEMENTS:
This is shown in Fig. 65.1 where cumulative percentage of households (i.e., recipients of income) arranged from the poorest to the richest (in terms of size of income) are represented on the horizontal axis and cumulative percentages of income of the households starting from the poorest to the richest are represented on the horizontal axis.
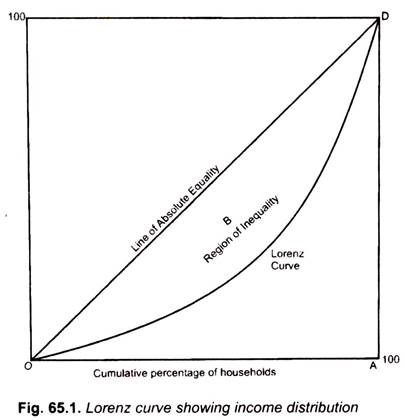
Straight diagonal line OD shows equal distribution of income according to which every household receives the same income and therefore Lorenz Curve representing perfect or absolute equality of income will be a diagonal line. When the distribution of income is less than perfect equality, Lorenz Curve will be below it, as shown by OD curve in Fig. 65.1. The line of perfect equality serves as a point of reference to which we compare actual or observed distribution of income in a society.
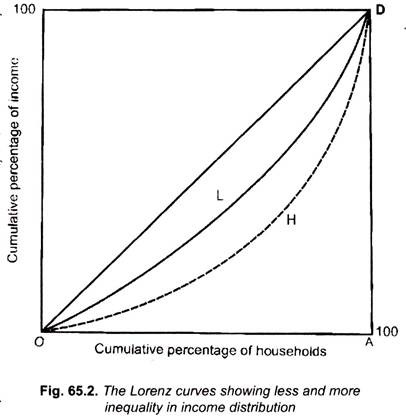
The shaded area between the line of perfect equality and the actually obtained Lorenz Curve such as OD represents the observed distribution of income, that is, inequality in a society. This shaded area is therefore generally described as ‘the region of inequality’. The larger the deviation of Lorenz Curve depicting actual income distribution from the line of perfect equality the greater the inequality of actual distribution of income. Thus, in Fig. 65.2, the Lorenz Curve H (dotted) will indicate greater inequality of income distribution than the Lorenz Curve L.
The maximum deviation of actual distribution from the line of perfect equality will be represented by the area of a triangle OAD in Fig. 65.2. According to Lorenz Curve criterion of income distribution, the farther the Lorenz curves to the line of absolute equality, the greater will be the inequality in the distribution of income. Thus in Fig. 65.2, the Lorenz curve H represents greater inequality in income distribution than Lorenz curve L.
ADVERTISEMENTS:
Gini Coefficient as a Measure of Inequality:
A conventional summary measure of inequality based on Lorenz curve is the Gini Coefficient named after the Italian economist who first suggested it in 1912. Gini Coefficient in Fig. 65.1 is given by the ratio of shaded area (representing the actual deviation of observed income distribution from the line of perfect equality) to the area of triangle OAD. Thus in 65.1, Gini Coefficient is given by the ratio of shaded area B to the total area of triangle OAD. Thus-
![]()
It is worth mentioning the following four properties of Gini Coefficient:
1. First, the value of Gini Coefficient will be between zero (in case of perfect equality) and unity (in case of perfect inequality).
2. Second, since the Gini Coefficient is based on ratio of shares represented by a Lorenz curve, it is a relative measure of inequality in income distribution. This implies that the same Lorenz curve may refer to the distribution around different levels of income. This must be taken into account while comparing different income distributions.
ADVERTISEMENTS:
3. In the third place, Gini Coefficient attempts to capture the extent of dispersion underlying the size distribution of income or consumption. Therefore, any statistical measure of distribution can be used to measure inequality in a given distribution of income.
4. Fourthly, the same Gini Coefficient may result from different Lorenz curves representing different income distribution patterns and therefore a unique relationship between the two does not exist. Let us illustrate this point with the help of Lorenz curve. Consider two Lorenz curves A and B with the same levels of mean income which cross each other as shown in Fig 65.3. This situation of intersecting Lorenz curves represents conflict situation. In this case of income distribution share of income accruing to certain sections of the population is lower and others higher in one situation than in the other.
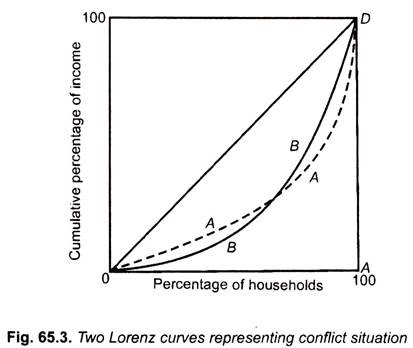
In Fig. 65.3, according to Lorenz curve A in the households at the bottom of income distribution there is more equality and in households with higher income levels the income distribution is more unequal. The opposite is case in Lorenz curve B in Fig. 65.3 where in the households at the bottom level there is more inequality while at the higher income level, income inequality is less. With the level of mean income being the same, the two Lorenz curves show different patterns of income distribution. The choice between such income distribution patterns represented by two Lorenz curves intersecting each other requires the resolution of conflict situations over which agreement regarding extent of inequality of income distribution may not be possible.
Coefficient of Variation (CV):
The coefficient of variation is a statistical measure of dispersion of income distribution. This measure gives more weight to larger deviation of households’ income from mean and therefore represents better measure of income inequality than the ‘mean absolute deviation’. Coefficient of variation is the most common measure of dispersion of income that is generally used by statisticians and is based on standard deviation (σ) which squares all deviations from the mean.
ADVERTISEMENTS:
Since square of a number rises more than proportionately to the number itself, this implies greater weight being assigned to the larger deviations from mean. The coefficient of variation is just the standard deviation divided by the mean and, therefore, it reflects only relative incomes. Let there be n individuals and m is the number of distinct incomes and j denotes an income class and nj denotes the number of individuals earning income in each income class. The coefficient of variation of an income distribution is written as –
In the above formula Yj is income of an household, Y̅ is the mean income, then (Yj– Y̅)2 is the square of deviation of income of an household from the mean. With summing up of such squared deviations of incomes of all households and then taking a square root of it we get standard deviation. Thus standard deviation (σ) is given by –
On dividing this standard deviation by the mean we have the following value of coefficient of variation –
Income Inequality:
ADVERTISEMENTS:
In Table 65.2, we have given the distributions of income or consumption of both developed and developing countries. It may be noted that the methods of collecting data, degree of coverage of income or consumption data differ from country to country. However, some adjustments in income or consumption data have been made by the World Bank to make them comparable. It is worth mentioning that data regarding income of the individuals or households is difficult to collect. Therefore, most surveys collect the consumption expenditure data of individuals or households and consumption expenditure is regarded as a proxy for income and inequalities in consumption expenditure are treated as inequalities in income.
Now, a glance at Table 65.2 will reveal that as judged by Gini index, inequality in distribution income/consumption expenditure there exist large differences in various countries of the world. In India in the year 2011 the bottom 20 per cent of the population received 8.5 per cent of income/consumption whereas the top or highest 20 per cent had 42.8 per cent share of the national income or consumption.
This shows that there exists a large inequality of income/consumption despite the aim of the first Six Five Year Plans (1951 to 1990) to reduce inequalities of income. The degree of inequality in India is also revealed by Gini index of 33.6 (Note that Gini index is Gini Coefficient multiplied by 100).
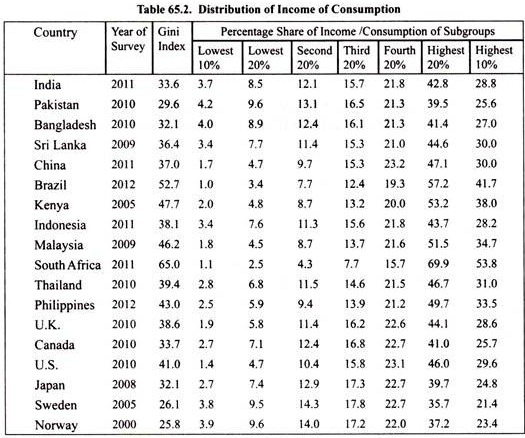
Now, the income distribution in China, which has been the fastest growing economy of the world in the last three decades, is noteworthy as since 1980s it has adopted the policy of privatisation and liberalisation with greater role to foreign investment to accelerate economic growth. It will be observed from Table 65.2 that in China in 2011, the top or the highest 20 per cent of population received 47.1 per cent of income/consumption while the bottom 20 per cent got only 4.7 per cent share of national income or consumption. It is the policy of privatisation and liberalisation of the economy that is responsible for the current large inequalities of income in China. Gini Coefficient in China in 2011 was 37.0 which is also quite high.
In Table 65.2, the worst developing country from the viewpoint of inequality is Brazil where Gini Coefficient in 2012 is 52.7 which is very high. Besides, in Brazil the top 20 per cent of population had 57.2 per cent share in national income/consumption, whereas the bottom 20 per cent received only 3.4 per cent share of it.
In the developed country of the US, inequalities in income distribution are quite large. In 2010, its Gini index was 41.0 which is quite high and in it while the top 20 per cent of population received 46 per cent of income, the bottom 20 per cent had only 4.7 per cent share in national income. In Japan, there exists less inequality in income distribution where the highest 20 per cent of population had a share of 39.7 per cent in national income consumption; the bottom 20 per cent received 7.4 per cent of it.
Of special mention are the Scandinavian countries of Sweden and Norway which have developed and become rich while maintaining relative equality in income distribution. It will be seen from Table 65.2 income inequalities in the distribution of income. In Sweden, the top 20 per cent of population had a share of 35.7 per cent in income/consumption whereas the lowest 20 per cent received 9.5 per cent of income. Gini index of income distribution of Sweden is equal to 26.1 which are quite small. The almost same situation regarding income distribution exists in Norway. The readers can themselves calculate Kuznets’ ratio from income distribution data of various countries given in Table 65.2.
Income Inequality, Economic Efficiency and Economic Growth:
Inequality, Incentives and Efficiency:
While movement towards reduction in economic inequality whether of income or wealth is generally regarded as socially desirable as it leads to increase in welfare of the society as a whole, but attempts have been made by some, especially those who are supporters of capitalism or a free market economy to defend income inequalities on grounds of adverse effect on economic efficiency and economic growth of reducing income inequalities. It is argued that a certain income distribution cannot be settled once and for all through redistribution because income distribution is a continuous process as production of goods and services goes on year after year and rewards for those who contribute to the production of goods and services are distributed every year.
Therefore, the question arises if inequality in distribution of income or rewards for the services is reduced, it may adversely affect the incentives to work hard and invest and as a result the production of goods and services may decline, that is, GDP or economic growth will be hurt.
It is thus argued that attempts to bring about equality, that is, to reduce income inequalities may reduce the size of pie which is to be distributed. The lower size of pie will reduce the well-being of the people. On the other hand, the attempts to reduce income inequalities will lower the efficiency or productivity as the people with higher abilities or productivities will not utilize their abilities or capabilities fully or put in best of their efforts. As a result, productive efficiency of the economy will decline which will lower economic growth of the country, which it is argued is a necessary condition for improving the levels of living of the population.
According to Late Prof. Suresh Tendulkar, “The work-incentive effect stands on a firmer ground. For one thing, interpersonal differences in the capacity to work and productivity of such work are established facts, although there is no agreement on the causes or measures of these differences. Again, while it may be possible to force a person to do a given job it is admitted that the efficiency with which he works will depend on the effort put in. This in turn is determined by the inherently individualised motivation factors which are influenced largely by the incentives provided in the shape of economic rewards.”
Related to the incentives required for full use of their capabilities is the question of incentives needed for the individuals to acquire education or higher skills or for the entrepreneurs to innovate. How can individuals or workers are induced to acquire higher skills and education to become more productive or entrepreneurs to innovate if they are to receive no more than the ordinary unskilled workers. It is thus argued that differential incomes or rewards are essential to achieve higher levels of productivity and growth.
The above incentive argument for inequalities of income has, however, a major loophole. Above argument would have been perfectly valid if perfect equality of income was intended to be established. As a matter of fact, nobody, not even the socialists, seeks to establish perfect or absolute equality of incomes. What is wanted is that reasonable inequalities of incomes should be established. The reasonable inequalities of incomes are those that are just sufficient to furnish or maintain the incentives.
Inequalities of income beyond the point necessary to furnish incentives are not justified on grounds of higher productivity and growth. Inequalities of income that prevail today are much more than what are required to furnish incentives to work hard and innovate or use their capabilities fully. Prevailing inequalities of incomes are so glaring and non-functional that even a substantial reduction in them will not adversely affect the incentives and therefore the fear that the national production or growth will fall as a result of equalitarian policies is unfounded.
Besides, the present large income inequalities found in the free market economies are quite unrelated to the differential capabilities of the individuals and are mainly based on extraneous factors such as ownership of property or assets, the existence of certain economic and social institutions. Furthermore, the important question is how to find reasonable or functional income inequalities which should therefore be socially acceptable.
This is a difficult question which cannot be answered unambiguously as this depends on value judgements of a society which can differ from one individual to another. Based on the value judgements of a society, preferably arrived at through democratic ways, we find socially acceptable degree of inequality which is of functional nature and sufficient to furnish incentives for individuals to put in their best efforts and use their capabilities fully and to acquire higher skills or education.
It is worth noting that there may be some trade-off between efficiency and equity, that is, some loss of efficiency may be sacrificed to have an equitable distribution of income, that is, a certain socially acceptable degree of income inequality.
It may be further noted that argument put forward for income inequality based on work-incentives does not apply to the people below the poverty line defined by minimum normative level of income just sufficient for subsistence. This is because lower than minimum level of income and consumption prevents them to be effective participant in economic activity. Due to their extremely low income they suffer from undernourishment, have inadequate clothing, shelter and healthcare. As a matter of fact, the eradication of poverty is a precondition for building up their capabilities to work and improve their efficiency.
Economists since Adam Smith have acknowledged the need for economic incentives for promoting economic growth and consequent inequality in economic rewards as the necessary price for furnishing economic incentives. An eminent economist, A.P. Lerner, drew distinction between functional and dysfunctional inequalities. The functional income inequalities are those that promote economic growth and dysfunctional are those that do not do so. Nevertheless, there is general abhorrence for growing income inequality and any reduction in it is universally taken as advancing equity. It is therefore, generally believed that government should intervene to bring about growth with equitable distribution of income especially in developing countries.
Therefore, in India, in the latest Five Year Plans (Eleventh and Twelfth Plans) the objective has been to achieve inclusion growth. It may be recalled that the concept of economic efficiency or what is called Pareto optimality takes the distribution of income in a society as given and explains how social optimum resource allocation is achieved. It does not go into the question of optimum distribution of income in a society. With a different income distribution, there will be different Pareto optimum. As a matter of fact, most government policies affect the distribution of income. This issue was even raised by classical economists Adam Smith and Ricardo who advocated free trade which benefits some and harms other members of the society.
N. Kaldor and J.R. Hicks provided a welfare criterion according to which if as a result of government policy those who gain can compensate the loss and still remain better off, the new situation would represent an improvement over the existing one. However, the serious drawback of this criterion is that the compensation visualised is potential and not real. Therefore, for increase in actual welfare when any growth project is undertaken those who are displaced must adequately be compensated and also alternative gainful employment opportunities are provided to them.
Furthermore, the present inequalities of income reflect the differences in opportunities faced by various individuals. A man is the product of numerous forces acting upon him. Some forces work before his birth. The result of these forces is that an individual possesses certain inborn qualities. Other influences upon man come from environment in which he grows up. This environment consists of conditions of home, family, friends, teachers, and general surroundings. Both these hereditary and environmental forces come from outside man himself. An individual who is born with the silver spoon in his mouth and is therefore brought up in superior home influences and receives good education and training is not likely to acquire higher skills and education. He will be able to earn large income.
On the other hand, a person who is born in a poor family and is brought up in the environment of dust, disease and despair and who cannot obtain sufficient education and training because of the poverty of his parents is not likely to acquire higher skills and education. He will be able to earn only a meagre income. Under these circumstances, it cannot be said that the former individual deserved success and large income and the latter failure and meagre income.
It is mere accident of birth and social conditions which have determined the success of the former individual and the failure of the latter. Each individual is the product of society. The wealth and richness of a man is mainly made possible by good heredity and favourable social environments. The poverty of the person who fails in life is due to bad heredity and unfavourable social environments. No one can claim with justification that his success and wealth are purely due to his personal efforts and that society has not contributed anything towards it.
Inequality, Saving and Capital Formation:
From the viewpoint of economic growth, a forceful argument advanced to justify income inequalities is that inequality in the distribution of income promotes savings and capital formation. Because of their higher incomes rich people are in a position to make more savings, and invest them. As a result, capital formation takes place in the society. The greater the inequality in the distribution of income, the greater will be the rate of saving and investment.
This increases the rate of capital formation. Capital formation is the key to economic growth. A higher rate of capital formation brings about rapid economic growth and greatly increases the level of national production. It is argued that if the national income is equally distributed, that is, if income equality is brought about, average rate of saving will fall. With the fall in saving the rate of investment and capital formation will decline. As a result, level of national production and rate of GDP growth will go down making everybody poorer than before.
It is thus concluded that large incomes which accrue to the rich people are really beneficial since a good part of them is saved and invested. This promotes capital formation and economic growth which in turn raise the levels of living of the people. In this way, according to this view, the rich are public benefactors.
The relation between inequality and capital formation established above is doubtful and uncertain. It may be true that in a capitalist system large savings are made possible by the huge incomes accruing to the few rich people. But it is quite wrong to hold that the rate of savings and capital formation will necessarily decline in any other economic system having relative equality of incomes. Indeed it may be said that the large incomes accruing to the rich people are not adequately utilised for the purposes of capital formation.
Quite a good amount of these high incomes is squandered away in conspicuous consumption. It is more conducive to capital formation if the surplus incomes of the rich come in the hands of the Government which can fully utilise them for investment in desired directions. Professor J.K. Galbraith, an eminent economist, applies remarks, “To give individuals large incomes to encourage savings has elements of illogic. The rich man saves because he is able to satisfy all his wants and then have some left over. Such a saving, in other words, is residual after luxurious consumption. This obviously is not an especially efficient way to promote capital formation”.
Even empirical evidence does not support the view that large inequality in the distribution of income is helpful to capital formation or that the drastic reduction in inequality of incomes will discourage saving and capital formation. For instance, Norway, which had adopted effective policies to promote equality of incomes, has achieved since the Second World War one of the highest rates of capital formation and economic growth in the non-communist countries. In sharp contrast, Middle East countries, where inequality of income is perhaps the greatest, are among those with lowest rates of capital formation.
Further, large inequalities of income may create economic instability which may adversely affect the investment and growth. Thus, Nobel Laureate Joseph E. Stieglitz in his recent book, “The Price of Inequality” points out that there is clear association between inequality and economic instability. According to him, in the US the people in top income-groups save a lot and relatively spend little, whereas the people in low and middle income groups save very little and spend all or most part of their incomes. This is the result of highly skewed income distribution and this reduces an aggregate consumption demand in a society which tends to reduce the level of GDP and thus causes economic instability.
However, in case of India when the problem is more on supply side, though large savings by the rich are good as they make large investment and growth possible but to rely on greater income inequalities to generate higher saving and investment is not the right approach. Many East Asian countries such as Singapore, Malaysia, Taiwan, and South Korea which achieved a higher rate of GDP growth from the mid-sixties to the mid-nineties did not experience the increase in income inequalities.
They were able to achieve high rates of economic growth with active participation of Government in their economies. Writing about growth miracle of East Asian countries, Joseph Sitglitz writes,” Their economic model included a strong role for the public sector. They clearly did not believe in free and unfettered markets but government played a critical role. Governments acted as catalyst which helped markets by providing the requisite physical and institutional infrastructure, by remedying market failures and by promoting saving and technology.”
Further, Stiglitz writes, contrary to what has happened in India, “East Asian countries proved that the initial stages of development did not have to be associated with an increase in inequality. Instead the new prosperity was widely shared among the population and millions were lifted out of poverty. For example, in Malaysia and Thailand, the incidence of poverty declined from almost 50 per cent in the 1960s to less than 20 per cent by the end of the century.”
Inequality is bad partly due to the fact that for any given average per capita income, the higher the inequality a larger number of people lacks the collateral to get loans from banks or any other source because, they are not credit-worthy. With low incomes, the people cannot educate their children and cannot spend adequately on their healthcare. As a result, their children remain uneducated and undernourished.
Besides, in case of India due to large income inequalities, as in other developing countries, the people in high income brackets such as big capitalists, landlords, high salary persons spend lavishly on imported goods, luxury cars, palatial houses, gold and jewellery etc. which have demonstration effect on the middle-income group people and tend to lower overall saving rate of the society by increasing their propensity to consume. It is thus evident that income inequalities are bad for achieving higher rate of saving and economic growth.
High income inequalities also promote rent seeking by the rich people who through excessive lobbying, providing large donations to the political parties, bribing the ministers and bureaucrats succeed in getting licenses and permits as happened in India in case of allotment of 2G spectrum and coal blocks. When large financial resources are used for such rent seeking activities, they are diverted from their productive use which could have generated rapid growth.
According to inverted U -hypothesis, as developing countries start growing in the initial stage inequalities of income will increase. On the basis of this hypothesis, the supporters of free market economy argued that increased inequality is a necessary condition for economic growth. However, relevant data collected by World Bank show that income inequality adversely affects economic growth.
Expressing the similar view Todaro and Smith write – “A growth strategy based on sizable and gross income inequalities may in reality be nothing more than an opportunistic myth designed to perpetuate the vested interests and maintain status quo of the economic and political elites of developing nations, often at the expense of the great majority of general population.”
Society’s Tolerance of Inequalities:
Recently, a view has been expressed about the conditions or circumstances in which income inequalities can be socially tolerated. Late Prof. Suresh Tendulkar provided an economic rationale for rising income inequalities during periods of rapid economic growth because they cause upward income mobility for the people. Rapid economic growth throws up opportunities for the people to move from low income to higher income levels despite the fact that income inequalities as measured by Gini Coefficient remain quite large. Thus, rapid economic growth generates hope for the people to move to higher income level category and makes the existence of large income inequalities socially acceptable.
However, according to Tendulkar, equity would be achieved in the normal course of market functioning without government intervention for reducing inequalities if technological changes reduce the relative price of one or more necessities of life or by enhancing the supply and consumption of necessities like food. Two things must be noted about this view of Late Prof. Tendulkar. First, if a free market economy experiences rapid economic growth, it will promote equity without intervention by the government to reduce income inequalities.
As it ensures upward income mobility, it will make the existing income inequalities socially acceptable Second, Tendulkar considers that if food and other necessities of life become cheaper and become more available for consumption as a result of rapid economic growth, income inequalities will become socially acceptable. In other words, if functioning of free market economy brings about rapid growth which causes absolute poverty to fall, the existing income inequalities will be socially acceptable. In our view, this is an indirect argument for a free market economy established by the policy of liberalisation and privatisation adopted under the structural adjustment reforms.
Like Tendulkar, long ago Hirschman had also argued that in a rapidly growing economy the improvement in the well-being of others may signal a benign external environment and hope for the rest. This hope or ‘expectations calculus’ produces gratification that overcomes envy and raises society’s tolerance for -inequalities. A noted welfare economist- Tibor Scitovsky was one of the earlier economists who suggested three criteria for social acceptability of inequalities.
First, the inequality that is based on merit or people’s contribution to social product can be considered as ‘functional inequalities’.
Second, those inequalities that arise even when there exist conditions of equality of opportunity which allow everyone to aspire to move up the income ladder.
Third, those inequalities that prevails along with the improvement in the well-being of those at the bottom of the income ladder. This third criterion advanced by Scitovsky implies that if economic growth benefits the poor, the prevailing income inequalities will be socially tolerable.