Let us make an in-depth study of the Assumptions, explanation and diagrammatic representation of the Harrod model of growth.
Assumptions of the Harrod Model:
Roy F. Harrod has presented his model in his publication “An essay on Dynamic Theory (1931)” and “Towards a Dynamic Theory (1948)”.
Harrod model has been constructed on the following assumptions:
1. Constant returns to seals holds.
ADVERTISEMENTS:
2. The level of ex-ante aggregate saving is a constant proportion of aggregate income.
3. The overall effect of technical progress is neutral.
4. The capital output and labour output ratios are assumed to be constant.
5. The entrepreneurs desire to undertake investment depending on how quickly output is increasing.
Explanation of the Harrod Model:
Prof. R.F. Harrod has raised three main issues on which he concentrates in his growth model. They are:
ADVERTISEMENTS:
(i) How can steady growth rate be achieved with a fixed capital output ratio i.e. capital co-efficient and the fixed saving income ratio i.e. propensity to save?
(ii) How can steady growth rate be maintained? In other words, what are the chief conditions for maintaining the stable growth?
(iii) How do the natural factors put a ceiling on the growth rate of the economy?
ADVERTISEMENTS:
To answer these three questions, Harrod’s model is based on three distinct rate of growth as:
(A) Actual Growth Rate (G).
(B) Warranted Growth Rate (Gw).
(C) Natural Growth Rate (Gn).
Let us explain these three aspects in details:
A. Actual Growth Rate (G):
In the Harrodian model the first fundamental equation is:
GC = s … (1)
Where G is the rate of growth of output in a given period of time and can be expressed as ∆Y/Y; C is the net addition to capital and is defined as the ratio of investment to the increase in income, i.e. I/∆Y and s is the average propensity to save, i.e., S/Y.
Substituting these ratios in the above equation we get:
The equation is simply a re-statement of the truism that ex-post (actual, realized) savings equal ex-post investment.
The above relationship is disclosed by the behaviour of income. Whereas S depends on Y, I depends on the increment in income (∆Y), the latter is nothing but the acceleration principle.
B. Warranted Rate of Growth (Gw):
The warranted rate of growth, according to Harrod, is the rate “at which producers will be content with what they are doing.” It is the “entrepreneurial equilibrium; it is the line of advance which, if achieved, will satisfy profit takers that they have done the right thing.” Thus this growth rate is primarily related to the behaviour of businessmen.
At the warranted rate of the growth, demand is high enough for businessmen to sell, what they have produced and they will continue to produce at the same percentage rate of growth. Thus, it is the path on which the supply and demand for goods and services will remain in equilibrium, given the propensity to save.
ADVERTISEMENTS:
Warranted growth rate can be expressed as:
GwCr = s ……. (2)
where Gw is the “warranted rate of growth” or the full capacity rate of growth of income which will fully utilize a growing stock of capital that will satisfy the entrepreneurs with the amount of investment actually made. It is the value of ∆Y/Y. Cr, the ‘capital requirements’, denotes the amount of capital needed to maintain the warranted rate of growth, i.e., required capital-output ratio. It is the value of I/∆ Y, or C. ’s’ is the same as in the first equation, i.e., S/Y.
The equation, therefore, states that if the economy is to advance at the steady rate of Gw that will fully utilize its capacity, income must grow at the rate of s/Cr per year, i.e., Gw = s/Cr.
ADVERTISEMENTS:
If income grows at the warranted rate, the capital stock of the economy will be fully utilised and entrepreneurs will be willing to continue to invest the amount of saving generated at full potential income. Gw is therefore a self-sustaining rate of growth and if the economy continues to grow at this rate, it will follow the equilibrium path.
Genesis of Long-run Disequilibria:
Full, full-employment growth, the actual growth rate of G must equal Gw. The warranted rate of growth that would give steady advance to the economy and C (the actual capital goods) must equal Cr (the required capital goods for steady growth).
If G and Gw are not equal, the economy will be in disequilibrium. For example, if G exceeds Gw, then C will be less than Cr. When G > Gw, shortages result. “There will be insufficient goods in the pipeline and/or insufficient equipment.” This situation leads to secular inflation because actual income grows at a faster rate than that allowed by the growth in the productive capacity of the economy.
It will further lead to a deficiency of capital goods, the actual amount of capital goods being less than the required capital goods (C < Cr). Under the circumstances, desired (ex-ante) investment would be greater than saving and aggregate production would fall short of aggregate demand.
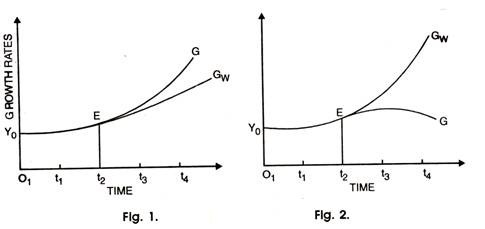
There would thus be chronic inflation. This is explained in Fig. 1. where the growth rates of income are taken on the vertical axis and time on the horizontal axis. Starting from the initial full-employment level of income Y0, the actual growth rate G follows the warranted growth path Gw upto point E through period t2. But from t2 onwards, G deviates from Gw and is higher than the latter. In subsequent periods, the deviation between the two becomes larger and larger.
ADVERTISEMENTS:
If, on the other hand, G is less than Gw, then C is greater than Cr. Such a situation leads to secular depression as actual income grows more slowly than what is required by the productive capacity of the economy leading to an excess of capital goods (C > Cr).
This means that desired investment is less than saving and that the aggregate demand falls short of aggregate supply. This will result fall in output, employment and income. There would thus be chronic depression. This has illustrated in Fig. 2. when from period f2 onwards G falls below Gw and the two continue to deviate further away.
Harrod states that once G departs from Gw, it will depart further and further away from equilibrium. He says: “Around that line of advance which if adhered to would alone give satisfaction, centrifugal forces are at work, causing the system to depart further and further from the required line of advance.” Thus the equilibrium between G and Gw is a knife-edge equilibrium. For once it is disturbed, it is not self-correcting. It follows that one of the major tasks of public policy is to bring G and Gw together in order to maintain long-run stability. For this purpose, Harrod introduces his third concept of the natural rate of growth.
C. Natural Rate of Growth (Gn):
“It is the rate of advance which the increase of population and technological improvements allow.” The natural rate of growth depends on the macro variables like population, technology, natural resources and capital equipment. In other words, it is the rate of increase in output at full-employment as determined by a growing population and the rate of technological progress. The equation for the natural rate of growth is
ADVERTISEMENTS:
Gn. Cr – or#s
Where Gn is the natural or full-employment rate of growth.
Balance between G, Gw and Gn:
Now for full-employment equilibrium growth Gn = Gw = G. But this is a knife-edge balance. For once, there is any difference between natural, warranted and actual rates of growth conditions of secular stagnation or inflation would be generated in the economy. If G > Gw, investment increases faster than saving and income rises faster than Gw. If G < Gw, saving increases faster than investment and rise of income is less than Gw.
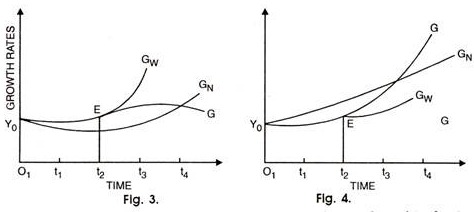
Thus, Harrod points out that if Gw>Gn secular stagnation will develop. In such a situation Gw is also greater than G because the upper limit to the actual rate is set by the natural rate as shown in Fig. 3. When Gw exceeds Gn, C > Cr and there is an excess of capital goods due to a shortage of labour. The shortage of labour keeps the rate of increase in output to a level less than Gw. Machines become idle which leads to excess capacity. This further dampens investment, output, employment and income. Thus the economy will be in the grip of chronic depression. Under such conditions saving is a vice.
If Gw<Gn, Gw is also less than G as shown in Fig. 4. The tendency is for secular inflation to develop in the economy. When Gw is less than Gn, C<Cr. There is a shortage of capital goods and labour is plentiful. Profits are high since desired investment is greater than realised investment and the businessmen have a tendency to increase their capital stock. This will lead to secular inflation. At this stage, saving is a virtue for it permits the warranted rate to increase.
This instability in Harrod’s model is due to the rigidity of its basic assumptions. They are a fixed production function, a fixed saving ratio, and a fixed growth rate of labour force. Economists have attempted to relieve this rigidity by permitting capital and labour substitution in the production function, by making the saving ratio a function of the profit rate and the growth rate of labour force as a variable in the growth process.
The policy implications of the model are that saving is a virtue in any inflationary gap economy and vice in a deflationary gap economy. Thus, in an advanced economy, V has to be moved up or down as the situation demands.
Diagrammatic Representation of Harrod’s Growth Process:
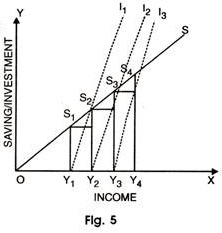
The figure 5 shows the growth process of Harrod’s model. Income is represented on the X-axis, and saving and investment on the Y-axis. SS is the saving line. This represents that different levels of income correspond to Y different levels of saving. The scope of this line represents the equality between z average propensity to save and marginal propensity to save. Slopes of Y1I1, Y2I2 lines indicate capital output ratio.
Initially, income is OY1 corresponding to is S1Y1 the saving. Investing this savings, income would rise by Y1Y2. At OY2 level of income, savings would rise to Y2 S2. This will stimulate investment; and income. Income would now by OY2. At OY3 level of income, saving would be S3Y3. Again investing in the economy, will further lead to rise of income. This growth process continues in this repetitive manner.


