
Let us make an in-depth study of the subject matter, assumptions, explanation and diagrammatic representation of the Domar model of growth.
Subject Matter of Domar Model:
Domar presented his growth model in his pioneer work expansion and employment in 1947.
Domar’s growth model addresses itself to the question as to what should be the rate of growth of investment so that the rate of growth of income coincides with the rate of growth of productive capacity.
In short, Domar’s Model is an attempt to determine the rate at which investment purchasing must increase in an economy, if full- employment levels of production are to be maintained.
ADVERTISEMENTS:
According to Domar, investment raises productive capacity on the one hand and on the other hand it raises total demand in terms of total income. Productive capacity can be optimally utilised only if there is equivalent demand for the goods produced. That is, for a state of equilibrium in the economy, it is required that total supply (or productive capacity) equals total demand (or income).
Assumptions of Domar Model:
1. There is an initial full employment level of income that has already been achieved.
2. Absence of government interference and foreign aids.
3. The marginal and average propensities to save are equal.
ADVERTISEMENTS:
4. There are no lags in adjustment.
5. The propensity to save and capital co-efficient are considered constant.
6. Depreciation is measured to the cost of replacement of depreciated asset by another one of the same productive capacity.
7. The economic system is closed.
Explanation of the Domar Model:
ADVERTISEMENTS:
Domar builds his model from both demand as well as the supply side. He stressed on the dual character of investment and it provided the solution for steady growth.
The various symbols used in Domar’s model are as under:
Yd = Level of national income or level of effective demand at full employment.
Y3 = Level of productive capacity or supply at full employment level.
K = Real capital
I = Net investment which results in the increases of real capital i.e. ∆ K.
α = Marginal propensity to save which is reciprocal of multiplier,
σ = Productivity of capital or net investment.
Domar started his model with the help of the equation given by K.K. Kurihara:
ADVERTISEMENTS:
Yd = I/ α
This equation shows that the level of national income is directly proportional to the net investment. Any increase in the level of investment increases the national income and vice-versa. The effective demand is inversely proportional to marginal propensity to save. Any increase in marginal propensity to save will decrease the level of effective demand and vice-versa. This equation explains the demand side of investment.
Ys = σK
This equation explains that supply of output (Ys) at full-employment depends upon two factors: productive capacity of capital c and amount of real capital (K). Any increase or decrease in any of these two factors will raise or reduce the supply of output. This is the supply side of investment.
ADVERTISEMENTS:
For equilibrium the demand and supply should balance
Yd = Ys
i.e. I/ α = σK
or I = α σ K
ADVERTISEMENTS:
This equation explains the condition for steady growth and it is possible only when investment equals the product of saving income ratio, capital productivity and capital stock. For this, we must give increment to the demand as well as to supply equation.
The demand and supply equations in incremental form are:
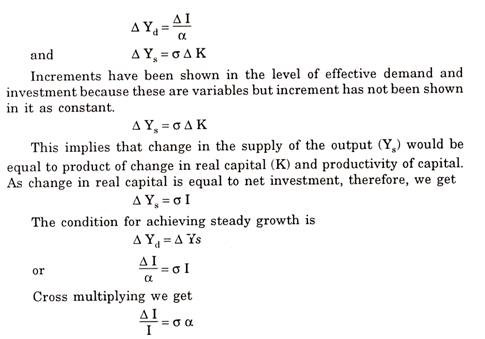
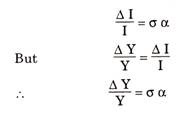
This implies that the growth rate of net investment must be equal to the product of marginal propensity to save and the productivity of capital. In the words of Kurihara, “It is an increase in productive capacity (Ys) due to increment of real capital (K) which must be matched by an equal increase in effective demand (∆Ed) due to an increment of investment (I), if a growing economy with an expanding stock of capital is to maintain continuous full-employment.” Thus, the necessary condition to maintain steady growth is
In the words of Meier and Baldwin, “The answer to the problem of what rate of growth is necessary to maintain a continuous state of full-employment is that investment and real income must grow at a constant annual percentage rate equal to the product of the propensity to save and the average productivity of investment.”
ADVERTISEMENTS:
Domar’s equation of steady growth can be explained with the help of a numerical example. Suppose a = 50% and a = 6% then
∆I/I = 50/100 X6/100 = 3/100 or 3%
Thus, income or investment must grow at an annual rate of 3 percent if full-employment growth rate is to be maintained. According to Brenner, “Full-employment requires that investment and income to grow at a constant annual relative rate equal to the product of propensity to save and the average productivity of investment.”
Diagram Representation of Domar Model:
Let us explain Domars model with the help of a diagram:
In this diagram, income has been exhibited on X-axis and investment on Y-axis. The line S(Y) passing through the origin shows the level of saving corresponding to different levels of income I0 I0, I1I1 and I2I2 are the various levels of investment. Similarly, Y0P0 and Y1P1 is the productivity of capital corresponding to different levels of investment. The productivity of capital remains unchanged as lines Y0P0 and Y1P1 are parallel.
The level of income is determined by the factors of saving and investment. The level of income Y0 is determined by intersection of saving line and investment line. When Y0 S0 is invested, the income will increase from OY0 to OY1 which, in turn, results in the increase in productive capacity.
ADVERTISEMENTS:
The rate of increase of income depends upon productivity of capital which is measured by the slope of the line Yp P0. Higher the slope of this line, higher will be the productivity of capital and vice-versa. When the level of income is OY1, the level of saving is Y0 S1 with this investment Y0S1the income will further rise to the level of OY2. This increase in income enhances the productive capacity of the economy.

In short, Domar Model has explained the technological relationship between the capital accumulation and full-employment growth rate of output. But, on the contrary, Harrod has shown the psychological relationship between capital accumulation and full capacity growth rate of output.
Therefore, Domar model suggests the role of planned investment in the economic development, while Harrod’s model stresses on induced investment.