
In this essay we will discuss about India’s Foreign Trade. After reading this essay you will learn about: 1. Introduction to India’s Foreign Trade 2. Direction of India’s Trade: Exports 3. Direction of India’s Trade: Imports 4. Composition of India’s Trade: Exports 5. Composition of India’s Trade: Imports 6. India’s Services Trade.
Contents:
- Introduction to India’s Foreign Trade
- Direction of India’s Trade: Exports
- Direction of India’s Trade: Imports
- Composition of India’s Trade: Exports
- Composition of India’s Trade: Imports
- India’s Services Trade
Essay # 1. Introduction to India’s Foreign Trade:
India’s foreign trade was largely determined by the strategic needs of the British colonial powers prior to its independence in 1947 Like other colonies, India too was a supplier of raw materials and agricultural commodities to Britain and other industrial countries and it used to import the manufactured goods from Britain.
The dependence of colonial India on Britain for manufactured goods hindered the process of industrialization and obliterated the indigenous handicraft and cottage industries.
ADVERTISEMENTS:
As a part of the British strategy, India had to export more than its imports prior to World War II, so as to meet the unilateral transfer of payments to Britain by way of the salaries and pensions of the British officers, both military and civil, dividends on British capital invested in India, and interest on sterling loans.
This helped India to achieve a favourable trade balance. In April 1946, India was able to build a huge sterling balance of Rs. 17.33 billion, even after paying of the sterling debt. However, the share of raw materials in India’s exports declined from 45 per cent in 1938-39 to 31 per cent in 1947-48 whereas the share of manufactured goods increased from 30 per cent in 1938-39 to 49 per cent in 1947-48.
It was only after independence that India’s trade patterns began to change in view of its developmental needs. India, as a newly independent country, had to import equipment and machinery that could not be manufactured domestically, in order to create new production capacity and build infrastructure, known as developmental imports.
It also had to import intermediate goods and raw material so as to make full use of its production capacity, known as maintenance imports.
ADVERTISEMENTS:
Moreover, as a newly developing country, it had to import consumer goods such as food grains that were in short supply domestically, in order to curb inflationary pressures. Such heavy dependence on imports adversely influences a country’s balance of trade. It necessitates the need to expand exports to finance its imports.
India’s exports grew significantly from US$1,269 billion in 1950-51 to US$155.5 billion in 2007-08 whereas imports increased from US$1,273 billion to US$235.9 billion (Fig. 3.12) during the same period. Exports have shown an increase of about 20 per cent during the last four decades, in four phases, i.e., during 1972-77, 1987-90, 1993-96, and 2000-04.
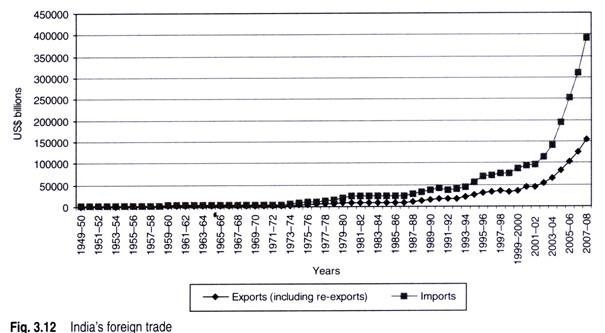
However, the exports increased remarkably at 30.8 per cent in 2004-05 and thereafter grew at around 23 per cent till 2007-08. A negative growth in exports was witnessed in the last three decades in 2001-02, exports declined by 1.6 per cent, in 1998-99 by 5.1 per cent, in 1991-92 by 1.5 per cent, and in 1985-86 by 9.9 per cent.
ADVERTISEMENTS:
It is also interesting to note that the growth of India’s exports has been much lower than that of some of the South East Asian economies whose share in international world trade rapidly increased.
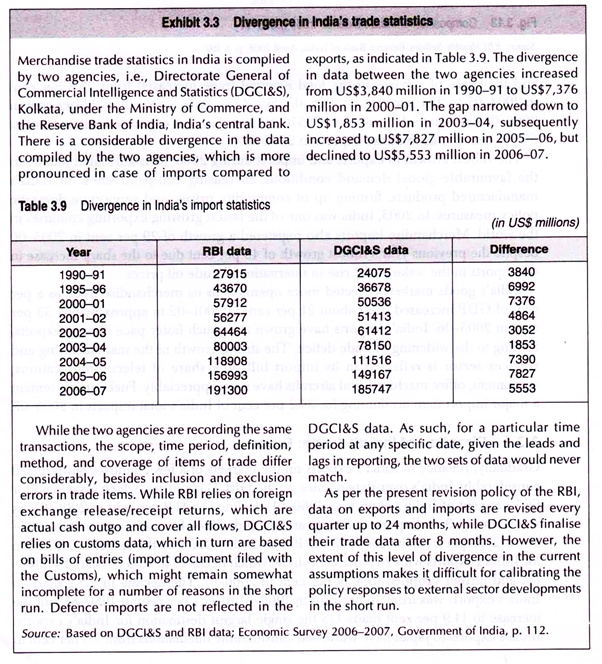
Data from the Directorate General of Commercial Intelligence and Statistics (DGCI&S) has been used to carry out the analysis of India’s. Trade data in India is also compiled by the country’s central bank, the Reserve Bank of India (RBI). There exists wide divergence in the data compiled by the two government agencies, as explicated in Exhibit 3.3.
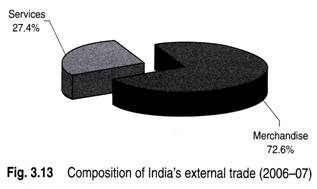
India’s total external trade, including goods and services, grew to US$433 billion in 2006-07. The trade in services has been growing faster than the merchandise trade, and the share of services in the total external trade increased from 25.8 per cent in 2004-05 to 27.4 per cent in 2006-07 (Fig. 3.13). With a growth of 32 per cent in 2006-07, services trade reached to US$76.2 billion.
Services exports constituted almost 60 per cent of merchandise exports in 2006-07.
The robust growth in exports and imports during 2006-07 is attributed mainly to the favourable global demand conditions, increasing competitiveness of India’s manufactured products, firming up of commodity prices, and supportive domestic policy measures.
In 2005, India was one of the fastest growing exporting countries in the world. Merchandise imports also registered a growth of 29 per cent in 2005-06 despite the previous year’s robust growth of 43 per cent due to the sharp increase in oil imports in the wake of the rise in international crude oil prices.
India’s goods markets reflected more openness as its merchandise trade as a per cent of GDP increased from about 21 per cent in 2001-02 to approximately 33 per cent in 2005-06. India’s imports have grown at a much faster pace than its exports, leading to the widening of trade deficit.
ADVERTISEMENTS:
The strong growth of the manufacturing and services sector is reflected in its import bill—the shares of telecommunications, equipment, office machines, and aircrafts have risen appreciably. Fuel imports remain a major import item accounting for 36.2 per cent of India’s total imports in 2006-07.
Essay # 2. Direction of India’s Trade: Exports:
Gradually, reliance of India’s exports on the markets of a few countries has reduced considerably. India’s over-dependence on the OECD countries, which accounted for 66.1 per cent of India’s exports in 1960-61, declined to 41.2 per cent in 2006-07, as shown in Fig. 3.14. Exports to European Union declined from 25.1 per cent in 1987- 88 to 20.4 per cent in 2006-07 In 1960-61, the UK was the largest destination for India’s exports with 26.9 per cent share, which declined to 6.55 per cent by 1987- 88, and further dropped to 4.39 per cent in 2006-07.
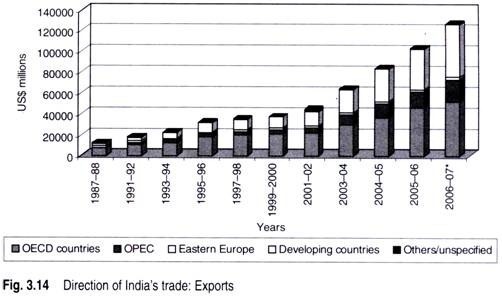
The decline in US’s share in India’s exports was from 16 per cent in 1960-61 to 11.1 per cent in 1980-81, but the increase to 14.9 per cent made US the single largest destination for India’s exports.
ADVERTISEMENTS:
India’s exports to Japan have witnessed considerable fluctuations from 5.5 per cent in 1960-61 to 13.3 per cent in 1970-71, which dropped down to 2.23 per cent in 2006- 07 OPEC has emerged as an important export destination for India, from 1.4 per cent share in 1960-61 to 16.4 per cent share in 2006-07 India’s to Russia, which increased remarkably from 4.5percentin 1960-61 to 18.3 per cent in 1980-81, sharply declined from 16.1 per cent in 1990-91, following the breakup of the USSR, to 3.3 per cent in 1995-96.
This further reached the all-time low of 0.72 per cent in 2006-07 India’s export share to developing countries remarkably increased from 14.2 per cent in 1987-88 to 40.1 per cent in 2006-07 India’s exports to SAARC jumped from 2 6 per cent in 1987-88 to 4.98 per cent in 2006-07 Besides, its exports to China increased remarkably from a negligible 0.1 per cent in 1990-91 to 6.56 per cent in 2006-07.
Moreover, India’s exports to Africa also grew from 2 per cent in 1987-88 to 702 per cent in 2006-07.
Essay # 3. Direction of India’s Trade: Imports:
Over the years, there has also been a significant change in value terms in the direction of India’s imports. India’s dependence on OECD countries for imports substantially declined from 78 per cent in 1960-61 to 59.8 per cent in 1987-88, which further declined to 36.5 per cent in 2006-07 (Fig. 3.15).
ADVERTISEMENTS:
India’s import, from European which accounted for 33.3 per cent in 1987-88, declined to 17.5 per cent in 2006-07. In 1960-61, the UK accounted for 19.4 per cent of India’s imports, which remarkably declined to 8.2 per cent by 1987-88 and came down to a meagre 2.19 per cent by 2006-07.
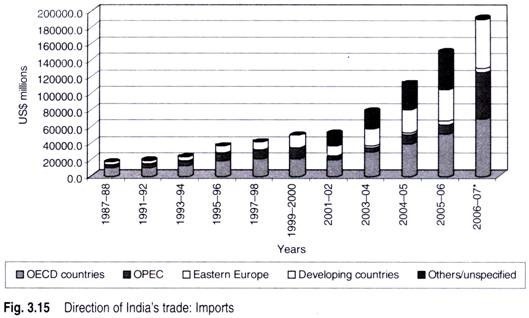
Moreover, the share of India’s imports from North America also declined significantly from 31 per cent in 1960-61 to 10.3 per cent by 1987-88, which further reduced to 7.41 per cent in 2006-07, mainly because of a substantial decline in the share of imports from US from 29.2 per cent in 1960-61 to 6.61 per cent in 2006-07.
The US still remains the single largest exporting country to India. The increase in the share of OPEC in India’s imports jumped from 4.6 per cent in 1960-61 to its peak of 278 per cent in 1980-81 due to the rise in India’s oil bill. However, this subsequently declined to 5.3 per cent in 2000-01 but remarkably grew later to 29.43 per cent in 2006-07, primarily due to the rise in oil prices.
India’s imports from developing countries grew remarkably from 17.3 per cent in 1987-88 to 31.27 per cent in 2006-07. The share of Asia in India’s imports steeply rose from 12.1 per cent in 1987-88 to 24.78 per cent in 2006-07 mainly because of the increased imports from other Asian developing countries, especially China, whose share in India’s imports jumped from 0.7 per cent in 1987-88 to 9.13 per cent in 2006-07.
The share of India’s imports from Africa also increased from 2.9 per cent in 1987-88 to 3.57 per cent in 2006-07. The share of other countries, which was almost negligible until 1999-2000, jumped to 31 per cent in 2001-02, which reveals increased diversification in India’s imports (Annexure III). However, this share plummeted to 0.44 per cent in 2006-07.
Essay # 4. Composition of India’s Trade: Exports:
ADVERTISEMENTS:
Over the last five decades, the composition of India’s exports has become more broad- based with visibly decreased dependency on any one product category. Moreover, a remarkable shift in India’s exports from agricultural products to manufactured goods had been a positive move. The share of manufactured goods in India’s exports steadily rose from 45.3 per cent in 1960-61 to 80.7 per cent in 1999-2000.
However, it subsequently started declining steadily and reached to about 68.6 per cent in 2006-07 (Fig. 3.16). Among the manufactured goods, gems and jewellery, which accounted a meagre 0.1 per cent in 1960-61, increased remarkably to a 20.4 per cent in 1999- 2000 but further declined to about 12.6 per cent in 2006-07.
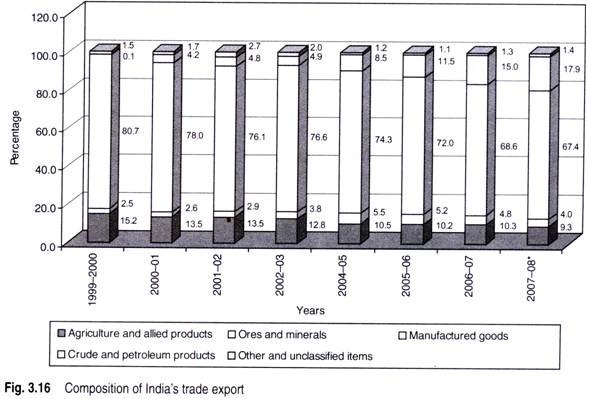
Besides, the share of readymade garments also grew remarkably from 0.1 per cent in 1960-61 to 12.9 per cent in 1999-00 but considerably declined to 70 per cent in 2006-07 Crude and petroleum products, which hardly had any exports of 0.1 per cent till 1999-2000, remarkably increased to about 15.0 per cent in 2006-07, mainly due to the higher international prices and the increased domestic refining capacity.
The exports of agricultural and allied products that comprised a significant 44.2 per cent share in 1960-61 declined to 31.7 per cent in 1970-71. It further declined significantly to 15.2 per cent in 1999-2000 and subsequently to 10.3 per cent in 2006-07. The share of jute and jute products sharply dropped from 21 per cent in 1960-61 to 0.31 per cent in 2002-03 and thereafter became insignificant in India’s export basket.
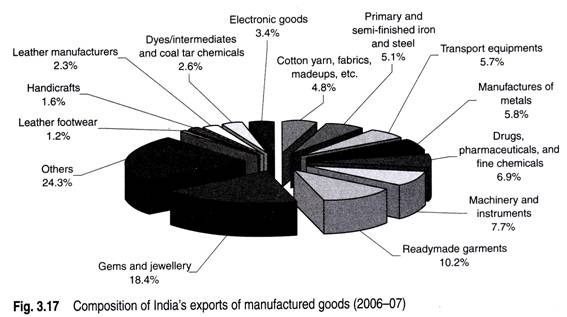
The composition of exports of manufactured goods from India in 2006-07 consisted of gems and jewellery (18.4%), readymade garments (10.2%), machinery and instruments (7.7%), drugs, pharmaceuticals, and fine chemicals (6.9%), manufacturer of metals (5.8%), transport equipment (5.7%), primary and semi-finished iron and steel (5.1%), cotton yam, fabrics, and made ups (4.8%), electronic goods (3.4%), dyes, intermediates, and coal tar chemicals (2.6%), leather and manufacturers (2.3%), handicrafts (1.6%), leather footwear (1.2%), and others (24.3%), as depicted in (Fig. 3.17).
ADVERTISEMENTS:
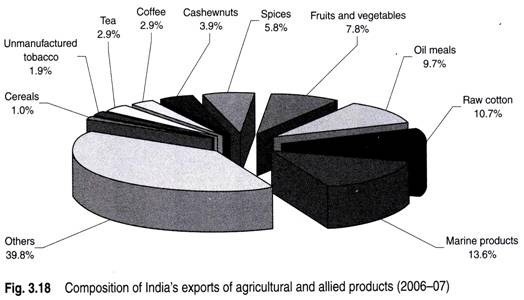
India’s exports of agricultural and allied products include marine products (13.6%), raw cotton (10.7%), oil meals (9.7%), fruits and vegetables (7.8%), spices (5.8%), cashewnuts (3.9%), coffee and tea (2.9%), unmanufactured tobacco (1.9%), cereals (1.0%), and others (39.8%), as shown in Fig. 3.18.
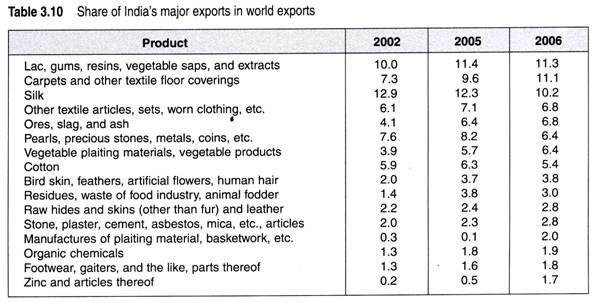
An analysis of the share of major exports of India in world exports as given in Table 3.10 reveals that India has more than 10 per cent share of the world market in case of lac, gums, resins, etc., carpets and textiles, and floor coverings and silk.
India’s share in cotton declined from 6.6 per cent in 2000 to 5.4 per cent in 2006 whereas the share of coffee, tea, and spices declined from 5.8 per cent in 2000 to 3.7 per cent in 2005. India’s share in world exports in ores, slag, and ash increased remarkably from 1.9 per cent in 2000 to 6.8 per cent in 2006.
Essay # 5. Composition of India’s Trade: Imports:
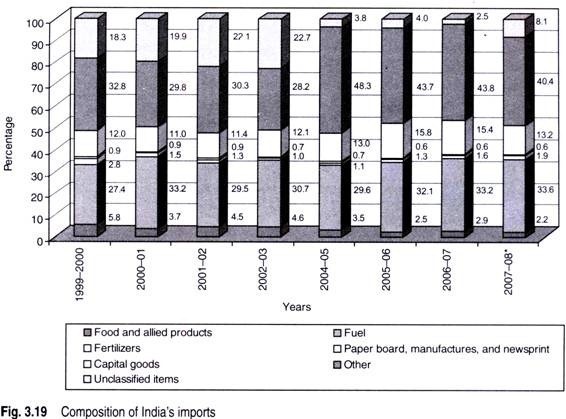
India’s imports primarily consist of petroleum products, fertilizers, capital goods, edible oils, etc., wherein there is little flexibility to reduce its imports bill. However, the imports witnessed a significant shift (Fig. 3.19) since independence.
ADVERTISEMENTS:
There had been a significant growth in India’s import of petroleum products from 6.1 per cent in 1960- 61 to about 30.8 per cent in 2006-07 due to the overall economic growth in the country, rise in petroleum prices, and limited indigenous exploration and refining.
The fertilizers accounted for 1.1 per cent of India’s total imports in 1960-61, increased with India’s green revolution to 5.2 per cent in 1970-71 and remained around 5 per cent by 1989-90. However, its import came down to 1.6 per cent in 2006-07 as a result of India’s remarkable progress in fertilizer production.
The share of cereal imports came down from 16.1 per cent in 1960-61 to 0.8 per cent in 1980-81. India became a net exporter of food grains, a fact that highlights the success story of the green revolution in India. However, the growing demands due to the rising population pressure and the vagaries of rain keep creating the need to import food grains from time to time.
Due to the greater rise in the demand for edible oils as compared to production, India’s dependency on edible oils increased remarkably as reflected by their import growth from 0.3 per cent in 1960-61 to 5.4 per cent in 1980-81. Subsequently, as a result of the comprehensive strategic measures taken to increase oilseed production, the import share declined to 0.6 per cent in 1989-90.
ADVERTISEMENTS:
However, it further increased to 3.7 per cent in 1999-2000, but declined later to 1.1 per cent in 2006-07. As India evolved its own capacity for manufacturing capital goods, its import share of capital goods declined substantially from 31.7 per cent in 1960-61 to 15.4 per cent in 2006-07.
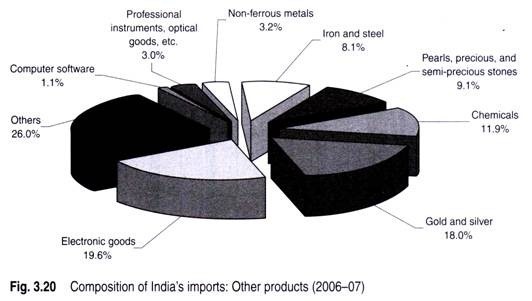
The other product categories in India’s imports, as depicted in Fig. 3.20, include electronic goods (19.6%), gold and silver (18.0%), chemicals (11.9%), pearls and precious and semi-precious stones (9.1%), iron and steel (8.0%), non-ferrous metals (3.2%), professional instruments, optical goods, etc. (3.0%), computer software (1.1%), and others (26.0%) in 2006-07.
Essay # 6. India’s Services Trade:
The services sector in India has grown remarkably and accounts for over 55 per cent of India’s GDP, making it the most significant component of the country’s economy. India’s services exports® have significantly grown from a meagre US$295 million in 1970-71 to US$76.2 billion in 2006-07, with a growth of 32.1 per cent over the previous year.
India’s services trade surplus as a percentage of GDP increased from 0.7 per cent in 2001-02 to 2.8 per cent in 2005-06 due to the surge in IT exports. There had been considerable growth in transport, travel, and other services, such as telecommunications, financial, construction, and legal.
The exports of these services were matched by corresponding imports. Therefore, the software services were mainly responsible for the surplus in services trade.
Over the years, the composition of services exports from India has undergone considerable change. Transportation accounted for 49.7 per cent in 1970-71 of India’s total services exports declined to 10.8 per cent in 2007-08 (Fig. 3.21 and Table 3.11).


Besides, the share of travel increased from 16.8 per cent in 1970-71 to 43.5 per cent in 1980-81, but declined subsequently to 12.9 per cent in 2007-08. There were hardly any software exports from India till 1990-91, which rapidly became the largest constituent of India’s services exports with 48.9 per cent share in 2003-04. However, this declined to 46.0 per cent in 2007-08.
The exports of the miscellaneous services category, which comprises of business services, financial services, and commercial services, grew remarkably from 14.4 per cent in 1970-71 to 34.5 per cent in 2006-07, however declined to 28.1 per cent in 2007-08.
An in-depth analysis of services exports from India reveals that the largest services segment, software and IT-enabled services, has graduated to newer services, such as packaged software implementation, systems integration, network infrastructure management, and IT consulting. There remains a huge untapped potential for IT-enabled services.
Under the miscellaneous services segment, India’s entertainment industry with export earnings of about US$230 million annually, is likely to grow by 70-80 per cent over the next five to ten years. It covers film, music, broadcast, television, and live entertainment and is basically an intellectual-property-driven sector with small to large players spread across India.
Education process outsourcing (EPO) includes imparting online education, training, and coaching, and other related services through the Internet and has emerged as a significant segment for services exports.
India s cost competitiveness as an education service provider (ESP) is reflected by an average billing rate in India of about US$ 12 per hour compared to US$25 per hour in the US, which is expected to be the largest consumer of EPO. The travel and tourism sector has also shown significant growth in recent years.