In this essay we will discuss about World Trade. After reading this essay you will learn about: 1. Introduction to World Trade 2. Direction of World Trade 3. Composition of World Merchandise Trade 4. World Commercial Services Trade 5. Direction of World Commercial Services Trade 6. Composition of World Commercial Services Trade.
Contents:
- Essay on Introduction to World Trade
- Essay on Direction of World Trade
- Essay on Composition of World Merchandise Trade
- Essay on World Commercial Services Trade
- Essay on Direction of World Commercial Services Trade
- Essay on the Composition of World Commercial Services Trade
Essay # 1. Introduction to World Trade:
World trade has grown considerably over the years. The world merchandise exports grew from US$59 billion in 1948 to US$13.57 trillion in 2007, and imports grew from US$62 billion to US$ 13.94 trillion during the same period.
The exports of services grew more rapidly compared to merchandise exports from US$390.8 billion in 1980 to US$3.26 trillion in 2007 whereas during the same period, imports rose from US$431.8 billion in 1980 to US$3.06 trillion in 2007.
ADVERTISEMENTS:
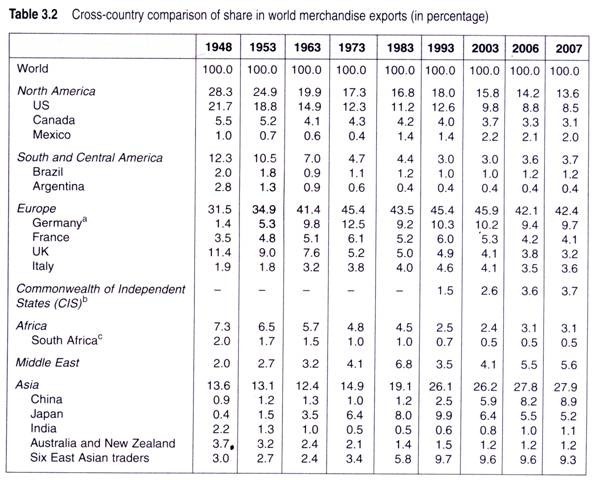
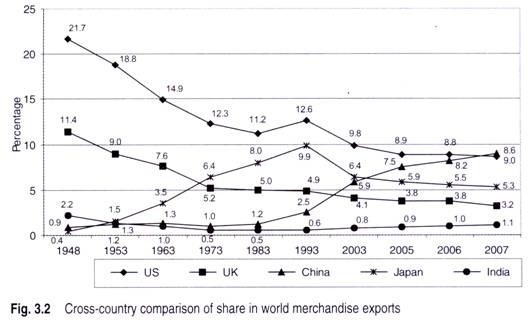
A cross-country comparison of the share of world merchandise exports (Table 3.2) reveals that the share of the US in the world merchandise exports significantly fell down from 21.7 per cent in 1948 to 8.6 per cent in 2007 whereas the share of the UK declined from 11.4 per cent in 1948 to 3.2 per cent in 2007 (Fig. 3.2).
The share of Japan and China increased significantly from 0.4 per cent and 0.9 per cent in 1948 to 5.3 per cent and 9.0 per cent, respectively, in 2007 While the share of Asian countries such as China and Japan grew remarkably in the world merchandise exports, India’s share in world trade declined from 2.2 per cent in 1948 to 1 per cent by 1963 and further to 0.5 per cent in 1973. In 1980, the erosion was lowest at 0.42 per cent.
However, it subsequently increased sluggishly to a 1.1 per cent share of world trade in 2007.
ADVERTISEMENTS:
World merchandise exports in dollar terms rose by 11 per cent to US$ 11.76 trillion during 2000-06 whereas commercial services export during the same period rose by 10 per cent to US$2.71 trillion. Inflation contributed to about 40 per cent of the value change in 2006 of the merchandise exports.
ADVERTISEMENTS:
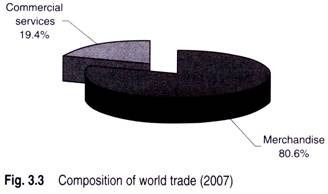
The commercial services with US$3.26 trillion accounted for 19.4 per cent whereas the merchandise exports with US$13.57 trillion in 2007 accounted for 80.6 per cent of world trade, as indicated in Fig. 3.3.
The review of world merchandise trade by leading exporters and importers reconfirms the importance of price developments and the outstanding trade performance of China and India. Since 2000, China has more than doubled its share in world merchandise exports.
Essay # 2. Direction of World Trade:
The direction of trade is often referred to describe the statistical analysis of the set of a country’s trading partners and their significance in trade. The set of countries where the goods are exported to and their significance on a country’s exports is known as the ‘direction of exports’.
On the other hand, the set of countries from where the goods are imported and their significance on a country’s imports is known as the ‘direction of imports’.
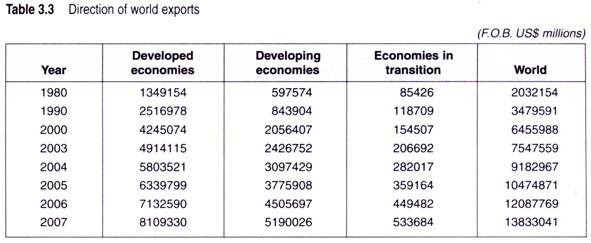
There has been a considerable change in the direction of world merchandise exports over the years, as indicated in Fig. 3.4. The developed economies have traditionally dominated the world exports with 66.39 per cent share in 1980, which increased to 72.34 per cent in 1990 but subsequently declined gradually to 58.62 per cent by 2007 (Table 3.3).
Developing economies that accounted for 29.41 per cent share in world exports in 1980 declined to 24.25 per cent in 1990, grew to 31.85 per cent in 2000, and further increased to 37.52 per cent in 2007. The share of economies in transition in world exports fell from 4.20 per cent in 1980 to 3.41 per cent in 1990 and 2.39 per cent in 2000. However, it subsequently increased to 3.14 per cent in 2007.
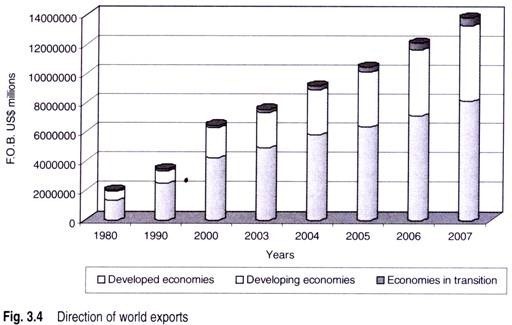
The exports of developed economies increased by 86.56 per cent during 1980-90 whereas it increased by 41.22 per cent for developing economies during this period. However, exports from developing economies rose remarkably by 143.7 per cent during 1990-2000 and 152.38 per cent during 2000-07, compared to 68.66 per cent and 91.03 per cent, respectively, from developed economies.
ADVERTISEMENTS:
The exports from the economies in transition grew merely by 38.96 per cent during 1980-90, but declined to 30.16 per cent during 1990-2000. However, the economies in transition exhibited a further remarkable jump to 180.69 per cent during 2000-07, making it the region with the highest export growth.
A region-wise comparison indicates that the share of North America in world merchandise exports declined significantly from 28.3 per cent in 1948 to 14.2 per cent in 2006 whereas the share of South and Central America fell from 12.3 per cent in 1948 to 3.6 per cent in 2006 and the share of Africa dropped from 73 per cent in 1948 to 3.1 per cent in 2006 (Table 3.2).
On the other hand, the share of Europe in world merchandise exports increased from 31.5 per cent in 1948 to 42.1 per cent in 2006, the share of the Middle East rose from 2 per cent to 5.5 per cent, and that of Asia grew from 13.6 per cent to 278 per cent during the same period.
ADVERTISEMENTS:
Regions with the highest share of fuels and other mining products in their merchandise exports, such as the Middle East (70%), Africa (65%), the CIS (60%), and South/Central America (37%) recorded the highest increase in their exports in 2006.
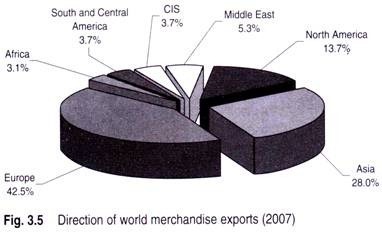
Out of the total world merchandise exports of US$13.57 trillions in 2007, Europe with US$5.76 trillion exports accounted for 42.5 per cent in 2007 followed by Asia with US$3.79 trillion (28.0%), North America with US$1.85 trillion (13.7%),
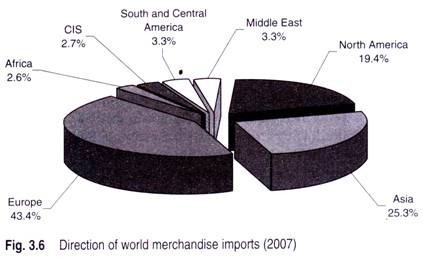
Middle East with US$721 billion (5.3%), CIS with US$508 billion (3.7%), South and Central America with US$496 billion (3.7%), and Africa with US$422 billion (3.1%), as depicted in Fig. 3.5. In 2007, Europe with US$6.05 trillion accounted for 43.4 per cent of world merchandise imports worth US$13.94 trillion (Fig. 3.6), followed by Asia with US$3.52 trillion (25.3%), North America with US$2.70 trillion (19.4%), Middle East with US$462 billion (3.3%), South and Central America with US$455 billion (3.3%), CIS with US$377 billion (2.7%), and Africa with US$355 billion (2.6%).
ADVERTISEMENTS:
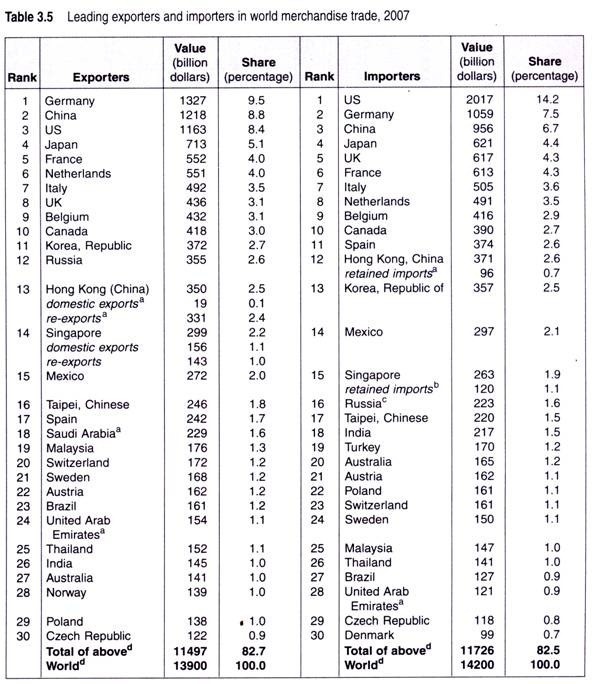
Germany ranked as the leading exporter in 2007 with US$1.32 trillion accounting for 9.5 per cent share of world exports, followed by China (8.8%), the US (8.4%), Japan (5.1%), and France (4.0%), as given in Table 3.5. The US remained the single largest importer with US$2.01 trillion, accounting for 14.2 per cent share of world imports, followed by Germany (75%), China (6.7%), Japan (4.4%), UK (4.3%), and France (4.3%).
India ranked at 26th position with US$ 145 billion, accounting for 1.0 per cent share in exports of world merchandise trade whereas it ranked at 18th with US$217 billion with 1.5 per cent share in merchandise imports in 2007.
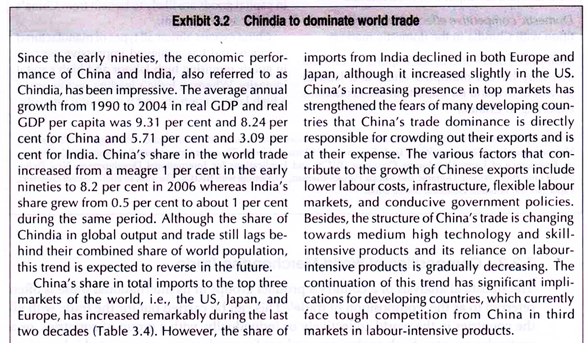
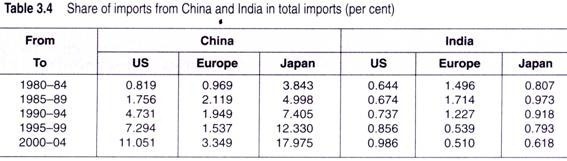
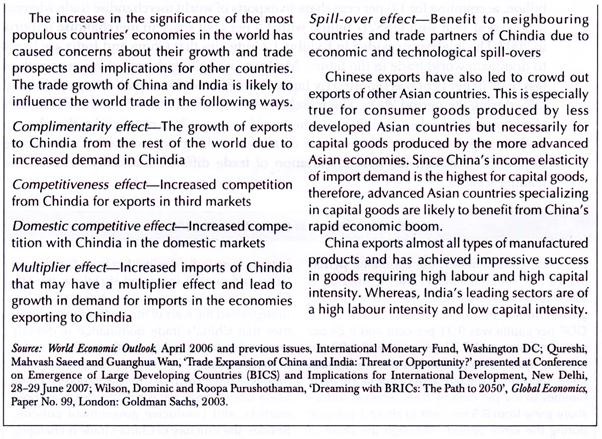
The analysis provided in Exhibit 3.2 indicates that China and India are likely to dominate world trade in the future. Moderate and sluggish export value growth of less than 10 per cent was reported by Japan (9%), France (6%), Spain (7%), and Ireland (3%) during the period 2006.
The merchandise imports (Table 3.5) of these countries also expanded far less rapidly than the world average. It is noteworthy that the ten leading exporters comprise the same countries as the group of the top ten leading importers, although the annual variation of trade differed markedly between the leading traders.
ADVERTISEMENTS:
Essay # 3. Composition of World Merchandise Trade:
The statistical analysis of a country’s product groups in its international trade is often referred to as the ‘composition of trade’. This can be carried out for the trade with all the countries in the world collectively or individually, with a group of countries, or a particular country.
Such analysis carried out for product groups exported is known as the ‘composition of exports’ whereas the analysis carried out for product groups imported is known as the ‘composition of imports’.
There has been a significant shift in the composition of world merchandise exports over the last four decades, as shown in Fig. 3.7. Food exports that accounted for 18.2 per cent of the world merchandise exports in 1965 declined to 6.7 per cent in 2000 and 6.2 per cent in 2006 (Table 3.6).
ADVERTISEMENTS:
Agricultural raw material that constituted 78 per cent of world merchandise export in 1965 declined to 1.9 per cent by 2000 and 1.5 per cent in 2006.
The share of ores, metals, and precious stones in world merchandise exports declined from 12 per cent in 1965 to 5.5 per cent in 2006, whereas the export of fuels grew from 9.6 per cent in 1965 to 24 per cent in 1980, but subsequently declined to 14.5 per cent by 2006. Manufactured goods have shown a gradual rise from 49.8 per cent in 1965 to 76.5 per cent in 2006.
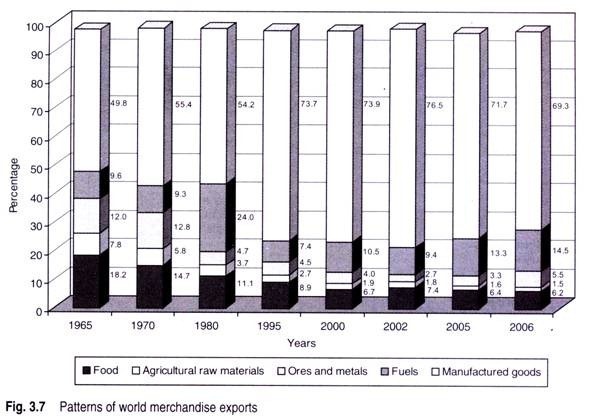
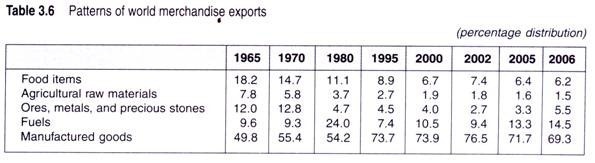
During recent years, weak and stagnating prices of food, agricultural raw materials, and manufactured goods contrasted with a further steep rise in prices for metals and fuels. The share of fuels increased to 13.3 per cent in 2005. On the other hand, the share of food and agricultural raw materials in the world merchandise exports decreased to a historic record low of 8 per cent in 2005.
Although recent oil price developments played a major role in the further relative decline of agricultural products in world merchandise exports, they only accentuated an existing long-term downward trend.
ADVERTISEMENTS:
The share of agricultural products in the world merchandise exports has decreased steadily over the last six years from more than 40 per cent in the early 1950s to 10 per cent in the late 1990s, as both volume and price trends have been less favourable than for other merchandise products.
Despite the decline in the share of agricultural products in world exports, the export value of agricultural products in world trade has increased thirty-folds between 1950 and 2005.
During the 1990s, the export value of electronic goods rose an average by 12 per cent or two times faster than all other manufactured goods. Among the manufactured goods, it is estimated that the largest value increases during recent years were for iron and steel products, as well for chemicals.
Although, there was a recovery in the global demand for computers and other electronic products, the growth rate of their trade value was less than that of manufactured goods.
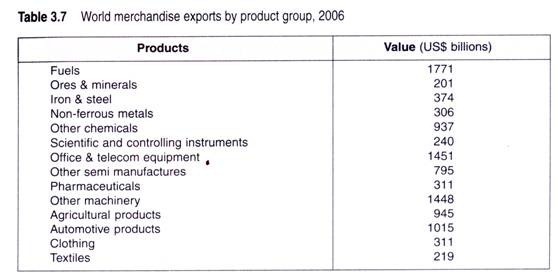
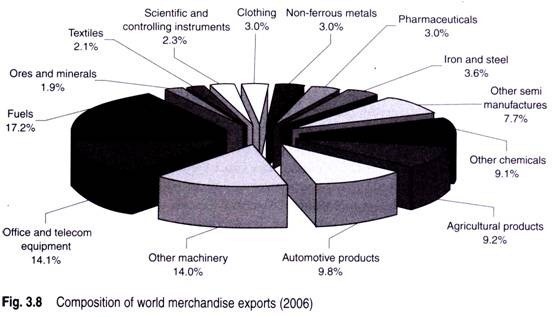
Fuels with exports worth US$ 1.8 trillion, as given in Table 3.7, accounted for 17.2 per cent of world merchandise exports in 2006, followed by office and telecommunication equipment’s (14.1%), other machinery (14.0%), automotive products (9.8%), agricultural products (9.2%), other chemicals (9.1%), other semi manufactures (7.7%), iron and steel (3.6%), clothing (3.0%), pharmaceuticals (3.0%), scientific and control instruments (2.3%), textiles (2.1%), and ores and minerals (1.9%), as shown in Fig. 3.8.
The growth in share of manufactures in total exports has a significant impact on the overall export. The gradual shift towards manufacturing has led to rapid export growth where the share of manufactured exports was already large.
Developing countries derived 70 per cent of the merchandise export revenue from the sales of primary commodities—agriculture and energy—two decades ago, whereas presently 80 per cent of the revenue comes from the export of manufactured goods.
Developing countries now rely less on the shipments of primary commodities than on manufactured goods. Even exports from sub-Saharan Africa are no longer resource based. The share of manufactures in African exports has risen from 25 per cent during the late 1970s to 67 per cent in 2006.
Essay # 4. World Commercial Services Trade:
The world commercial services exports rose by 21 per cent to US$3.26 trillion in 2007. Since the commercial services data are derived from BoP statistics, it does not include the sales of majority-owned foreign affiliates abroad. The expansion rate of global services trade has remained largely consistent during the last six years.
‘Other commercial services’, which includes software, education, health financial services, etc., has been the fastest growing category at 12 per cent growth in the world exports of commercial services trade.
Asia’s commercial services exports continued to expand faster than the global average for the third consecutive year in 2006 and also faster than the region’s services imports, thereby reducing the region’s deficit and service trade. India continues to excel in its services trade expansion.
Essay # 5. Direction of World Commercial Services Trade:
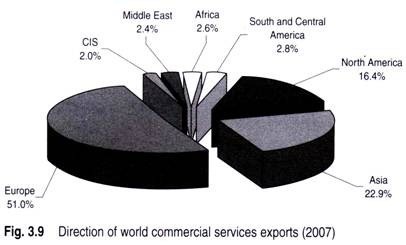
In 2007, Europe with US$1.66 trillion accounted for 51 per cent of total world commercial services exports (Fig. 3.9) worth US$3.26 trillion, followed by Asia with US$745 billion (22.9%), North America with US$533 billion (16.4%), South and Central America with US$91 billion (2.8%), Africa with US$84 billion (2.6%), Middle East with US$79 billion (2.4%), and CIS with US$64 billion (2.0%).
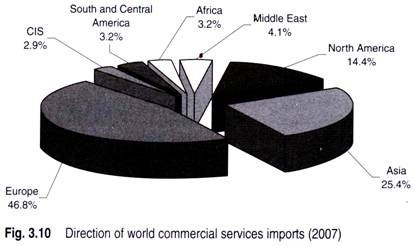
Europe also ranked as the highest importer of world commercial services with US$ 1.43 trillion (46.8%), followed by Asia with US$778 billion (25.4%), North America with US$440 billion (14.4%), Middle East with US$125 billion (4.1%), Africa and South Central America with US$97 billion (3.2%), and CIS with US$90 billion (2.9%) of the total import of world commercial services (Fig. 3.10) worth US$3.06 trillion in 2007.
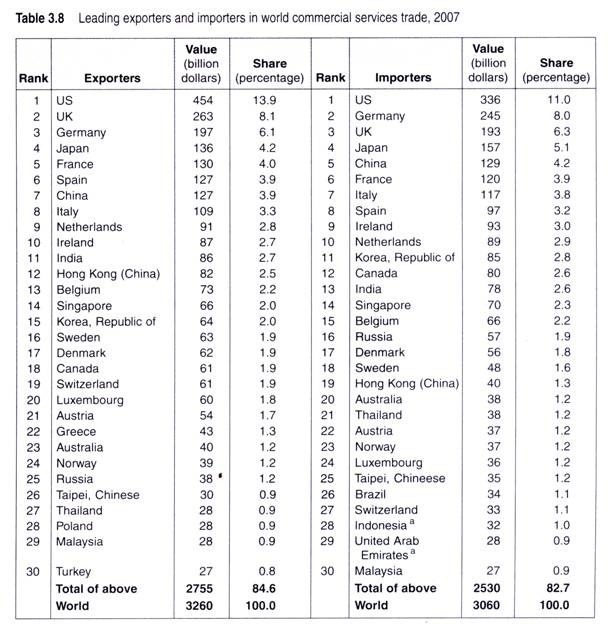
A country-wise analysis of world commercial services as delineated in Table 3.8 reveals that the US was the largest exporter of commercial services in 2007 with US$454 billion, accounting for 13.9 per cent of the world commercial services trade, followed by the UK (8.1%), Germany (6.1%), Japan (4.2%), and France (4.0%).
The US was also the largest importer of services with US$336 billion, accounting for 11.0 per cent, followed by Germany (8.0%), UK (6.3 %), Japan (5.1%), and China (4.2%). India ranked at 11th position with US$86 billion, accounting for 2.7 per cent share in export of world commercial services whereas it ranked 13th with US$78 billion with 2.6 per cent share in services imports in 2007.
Essay # 6. Composition of World Commercial Services Trade:
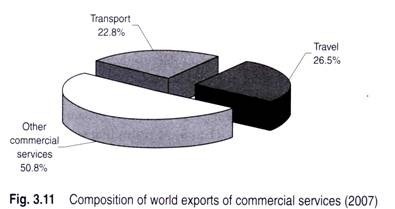
The category-wise break-up of commercial services of exports in Fig. 3.11 indicates that travel accounted for US$862 billion (26.5%), transport for US$742 billion (22.8%), and other commercial services for US$1653 billion (50.8%).
It is interesting to note that other commercial services are not only the largest category but also the fastest growing category. During 2000-06, the world trade of commercial services grew at the rate of 10 per cent, wherein transport increased by 10 per cent, travel by 7 per cent, and other commercial services rose by 12 per cent.