List of mathematical tools used in economics: 1. Concept 2. Function 3. Equation of a Straight Line 4. Slope of a Line.
1. Concept:
Theories in economic analysis explain various economic problems by establishing relationships between economic variables. In other words, they model the relationships between two or more economic variables. In establishing such relationships, they apply numerous mathematical tools such as functions, equations, graphs, calculus, algebra, derivatives, etc., in order to quantify the facts.
In modeling the relationship between variables, some of the variables are explained within the theory and their values are dependent on the variables within the model itself. These variables are called endogenous variables. There are other variables outside the model that can have an influence on the variables in the model.
These variables are called exogenous variables. The values of the exogenous variables are not dependent on the variables in the model. They are determined by factors outside the model.
ADVERTISEMENTS:
For instance, while modeling the demand for a commodity, price is an endogenous variable that influences the demand for the product. Other variables such as income of the consumers, tastes and preferences, etc., are all exogenous variables since they are not influenced by the variables in the model.
2. Function:
Economic models establish relationship between two or more economic variables. Such relationships may sometimes be expressed in the form of a function. A function is an expression of the relationship between two or more variables. A demand function is expressed as Qd = f(P), where Qd represents the quantity demanded, P is the price of the commodity and/represents the functional relationship. It is read as “quantity demanded is a function of price”.
3. Equation of a Straight Line:
Equations are tools that are used to express the functional relationship between the variables. The demand function, for instance, is expressed in the form of an equation as-
Qd = a-bP
ADVERTISEMENTS:
In the above equation ‘a’ is the intercept which is independent of the change in price. It shows the quantity of a commodity which will be demanded when the price is zero. Similarly ‘b’ is the rate of change which shows by how much the quantity demanded would change for a unit change in the price of the commodity. So ‘b’ is the coefficient of price.
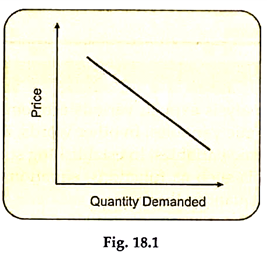
The functional relationship between variables may be linear or non-linear. In a linear relationship, the ratio of change in the dependent variable to the change in the independent variable is constant.
When the relationship is linear, the graph representing the relationship would be a straight line as shown below:
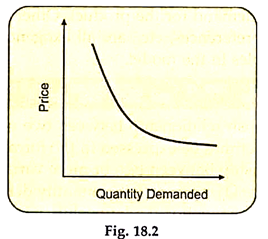
When the relationship is non-linear, the graph showing the relationship between the variables would be a curve. When the ratio of change in the dependent variable to the change in the independent variable is not constant, then the line showing the relationship between the dependent and the independent variable would be a nonlinear curve, as shown below-
4. Slope of a Line:
The slope of a line is an important feature in studying the relationship between variables. It shows the rate of change in the dependent variable as the independent variable changes. The demand equation Qd = a- bP is a linear function, where b represents the slope of the demand curve. When b is negative, the line slopes down from left to right and when b is positive, the line slopes up from left to right.
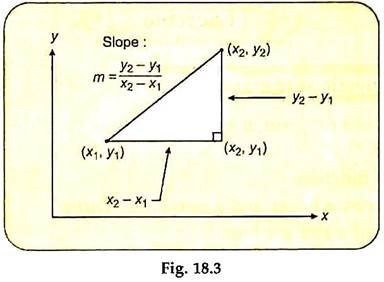
The slope of a line is the ratio of change in the dependent variable to the change in the independent variable.
It is mathematically expressed as:
Consider the demand equation, Qd = 25 – 2P. Here, 25 is the Y intercept, which shows the demand that is independent of the price and – 2 is the coefficient of price, which indicates that for a unit increase in the price, the quantity demanded would fall by 2 units.
Consider the supply equation, Qs = 25 + 2P. Here, + 2 is the coefficient of price and is positive. Thus, a unit increase in the price of the commodity would increase the quantity supplied by 2 units.
When the equation of a curve is known, it helps in predicting one variable when the other variable is given.
ADVERTISEMENTS:


