
A project report on Demand Forecasting. This report will help you to learn about:- 1. Meaning of Demand Forecasting 2. Procedure to Prepare Sales Forecast 3. Types 4. Techniques 5. Criteria of a Good Forecasting Method 6. Demand Forecasting in India.
Contents:
- Project Report on the Meaning of Demand Forecasting
- Project Report on the Procedure to Prepare Sales Forecast
- Project Report on the Types of Demand Forecasting
- Project Report on the Techniques of Demand Forecasting
- Project Report on the Criteria of a Good Forecasting Method
- Project Report on Demand Forecasting in India
Project Report # 1. Meaning of Demand Forecasting:
Forecasts are becoming the lifetime of business in a world, where the tidal waves of change are sweeping the most established of structures, inherited by human society. Commerce just happens to the one of the first casualties. Survival in this age of economic predators, requires the tact, talent and technique of predicting the future. Forecast is becoming the sign of survival and the language of business.
All requirements of the business sector need the technique of accurate and practical reading into the future. Forecasts are, therefore, very essential requirement for the survival of business. Management requires forecasting information when making a wide range of decisions.
ADVERTISEMENTS:
The sales forecast is particularly important as it is the foundation upon which all company plans are built in terms of markets and revenue. Management would be a simple matter if business was not in a continual state of change, the pace of which has quickened in recent years.
It is becoming increasingly important and necessary for business to predict their future prospects in terms of sales, cost and profits. The value of future sales is crucial as it affects costs profits, so the prediction of future sales is the logical starting point of all business planning.
A forecast is a prediction or estimation of future situation. It is an objective assessment of future course of action. Since future is uncertain, no forecast can be cent per cent correct. Forecasts can be both physical as well as financial in nature. The more realistic the forecasts, the more effective decisions can be taken for tomorrow.
In the words of Cundiff and Still, “Demand forecasting is an estimate of sales during a specified future period which is tied to a proposed marketing plan and which assumes a particular set of uncontrollable and competitive forces”. Therefore, demand forecasting is a projection of firm’s expected level of sales based on a chosen marketing plan and environment.
Project Report # 2. Procedure to Prepare Sales Forecast:
Companies commonly use a three-stage procedure to prepare a sales forecast. They make an environmental forecast, followed by an industry forecast, and followed by a company’s sales forecast, the environmental forecast calls for projecting inflation, unemployment, interest rate, consumer spending, and saving, business investment, government expenditure, net exports and other environmental magnitudes and events of importance to the company.
ADVERTISEMENTS:
The industry forecast is based on surveys of consumers’ intention and analysis of statistical trends is made available by trade associations or chamber of commerce. It can give indication to a firm regarding the direction in which the whole industry will be moving. The company derives its sales forecast by assuming that it will win a certain market share. All forecasts are built on one of the three information bases: What people say? What people do? What people have done?
Project Report # 3. Types of Demand Forecasting:
Forecasts can be broadly classified into:
(i) Passive Forecast, and
ADVERTISEMENTS:
(ii) Active Forecast.
Under passive forecast prediction about future is based on the assumption that the firm does not change the course of its action. Under active forecast, prediction is done under the condition of likely future changes in the actions by the firms.
From the view point of ‘time span’, forecasting may be classified into two, viz., (i) short term demand forecasting and (ii) long term demand forecasting. In a short run forecast, seasonal patterns are of much importance. It may cover a period of three months, six months or one year. It is one which provides information for tactical decisions.
Which period is chosen depends upon the nature of business. Such a forecast helps in preparing suitable sales policy. Long term forecasts are helpful in suitable capital planning. It is one which provides information for major strategic decisions. It helps in saving the wastages in material, man hours, machine time and capacity. Planning of a new unit must start with an analysis of the long term demand potential of the products of the firm.
There are basically two types of forecast, viz., (i) External or national group of forecast, and (ii) Internal or company group forecast. External forecast deals with trends in general business. It is usually prepared by a company’s research wing or by outside consultants.
Internal forecast includes all those that are related to the operation of a particular enterprise such as sales group, production group, and financial group. The structure of internal forecast includes forecast of annual sales, forecast of products cost, forecast of operating profit, forecast of taxable income, forecast of cash resources, forecast of the number of employees, etc.
At different levels forecasting may be classified into (i) Macro-level forecasting, (ii) Industry- level forecasting, (iii) Firm- level forecasting and (iv) Product-line forecasting. Macro-level forecasting is concerned with business conditions over the whole economy. It is measured by an appropriate index of industrial production, national income or expenditure.
Industry-level forecasting is prepared by different trade associations. This is based on survey of consumers’ intention and analysis of statistical trends. Firm-level forecasting is related to an individual firm. It is most important from managerial view point. Product-line forecasting helps the firm to decide which of the product or products should have priority in the allocation of firm’s limited resources.
Forecast may be classified into (i) general and (ii) specific. The general forecast may generally be useful to the firm. Many firms require separate forecasts for specific products and specific areas, for this general forecast is broken down into specific forecasts.
ADVERTISEMENTS:
There are different forecasts for different types of products like (i) Forecasting demand for nondurable consumer goods, (ii) Forecasting demand for durable consumer goods, (iii) Forecasting demand for capital goods, and (vi) Forecasting demand for new-products.
(i) Non-Durable Consumer Goods:
These are also known as ‘single-use consumer goods’ or perishable consumer goods. These vanish after a single act of consumption. These include goods like food, milk, medicine, fruits, etc. Demand for these goods depends upon household disposable income, price of the commodity and the related goods and population and characteristics.
Symbolically,
Dc= f (y, s, p, pr)
ADVERTISEMENTS:
where
Dc = the demand for commodity c
y = the household disposable income
s = population
ADVERTISEMENTS:
p = price of the commodity c
pr = price of its related goods
(i) Disposable income expressed as Dc = f(y) i.e. other things being equal, the demand for commodity c depends upon the disposable income of the household. Disposable income of the household is estimated after the deduction of personal taxes from the personal income. Disposable income gives an idea about the purchasing power of the household.
(ii) Price, expressed as Dc = f (p, pr) i.e. other things being equal, demand for commodity c depends upon its own price and the price of related goods. While the demand for a commodity is inversely related to its own price of its complements. It is positively related to its substitutes. Price elasticities and cross elasticities of non-durable consumer goods help in their demand forecasting.
(iii) Population, expressed as Dc = f (s) i.e., other things being equal, demand for commodity c depends upon the size of population and its composition. Besides, population can also be classified on the basis of sex, income, literacy and social status. Demand for non-durable consumer goods is influenced by all these factors. For the general demand forecasting population as a whole is considered, but for specific demand forecasting division of population according to different characteristics proves to be more useful.
(ii) Durable Consumer Goods:
These goods can be consumed a number of times or repeatedly used without much loss to their utility. These include goods like car, T.V., air-conditioners, furniture etc. After their long use, consumers have a choice either these could be consumed in future or could be disposed of.
ADVERTISEMENTS:
The choice depends upon the following factors:
(i) Whether a consumer will go for the replacement of a durable good or keep on using it after necessary repairs, depends upon his social status, level of money income, taste and fashion, etc. Replacement demand tends to grow with increase in the stock of the commodity with the consumers. The firm can estimate the average replacement cost with the help of life expectancy table.
(ii) Most consumer durables are consumed in common by the members of a family. For instance, T.V., refrigerator, etc. are used in common by households. Demand forecasts for goods commonly used should take into account the number of households rather than the total size of population. While estimating the number of households, the income of the household, the number of children and sex-composition, etc. should be taken into account.
(iii) Demand for consumer durables depends upon the availability of allied facilities. For example, the use of T.V., refrigerator needs regular supply of power, the use of car needs availability of fuel, etc. While forecasting demand for consumer durables, the provision of allied services and their cost should also be taken into account.
(iv) Demand for consumer durables is very much influenced by their prices and their credit facilities. Consumer durables are very much sensitive to price changes. A small fall in their price may bring large increase in demand.
(iii) Forecasting Demand for Capital Goods:
Capital goods are used for further production. The demand for capital good is a derived one. It will depend upon the profitability of industries. The demand for capital goods is a case of derived demand. In the case of particular capital goods, demand will depend on the specific markets they serve and the end uses for which they are bought.
ADVERTISEMENTS:
The demand for textile machinery will, for instance, be determined by the expansion of textile industry in terms of new units and replacement of existing machinery. Estimation of new demand as well as replacement demand is thus necessary.
Three types of data are required in estimating the demand for capital goods:
(a) The growth prospects of the user industries must be known,
(b) The norm of consumption of the capital goods per unit of each end-use product must be known, and
(c) The velocity of their use.
(iv) Forecasting Demand for New Products:
The methods of forecasting demand for new products are in many ways different from those for established products. Since the product is new to the consumers, an intensive study of the product and its likely impact upon other products of the same group provides a key to an intelligent projection of demand.
ADVERTISEMENTS:
Joel Dean has classified a number of possible approaches as follows:
(a) Evolutionary Approach:
It consists of projecting the demand for a new product as an outgrowth and evolution of an existing old product.
(b) Substitute Approach:
According to this approach the new product is treated as a substitute for the existing product or service.
(c) Growth Curve Approach:
ADVERTISEMENTS:
It estimates the rate of growth and potential demand for the new product as the basis of some growth pattern of an established product.
(d) Opinion-Poll Approach:
Under this approach the demand is estimated by direct enquiries from the ultimate consumers.
(e) Sales Experience Approach:
According to this method the demand for the new product is estimated by offering the new product for sale in a sample market.
(f) Vicarious Approach:
By this method, the consumers’ reaction for a new product are found out indirectly through the specialised dealers who are able to judge the consumers’ needs, tastes and preferences.
The various steps involved in forecasting the demand for non-durable consumer goods are the following:
(a) First identify the variables affecting the demand for the product and express them in appropriate forms,
(b) Gather relevant data or approximation to relevant data to represent the variables, and
(c) Use methods of statistical analysis to determine the most probable relationship between the dependent and independent variables.
Project Report # 4. Techniques of Demand Forecasting:
Demand forecasting is a difficult exercise. Making estimates for future under the changing conditions is a Herculean task. Consumers’ behaviour is the most unpredictable one because it is motivated and influenced by a multiplicity of forces. There is no easy method or a simple formula which enables the manager to predict the future. Economists and statisticians have developed several methods of demand forecasting.
Each of these methods has its relative advantages and disadvantages. Selection of the right method is essential to make demand forecasting accurate. In demand forecasting, a judicious combination of statistical skill and rational judgment is needed.
Mathematical and statistical techniques are essential in classifying relationships and providing techniques of analysis, but they are in no way an alternative for sound judgment. Sound judgment is a prime requisite for good forecast.
The judgment should be based upon facts and the personal bias of the forecaster should not prevail upon the facts. Therefore, a mid way should be followed between mathematical techniques and sound judgment or pure guess work. The more commonly used methods of demand forecasting are discussed below.
The various methods of demand forecasting can be summarised in the form of a chart as shown in Table 1.

1. Opinion Polling Method:
In this method, the opinion of the buyers, sales force and experts could be gathered to determine the emerging trend in the market.
The opinion polling methods of demand forecasting are of three kinds:
(a) Consumer’s Survey Method or Survey of Buyer’s Intentions:
In this method, the consumers are directly approached to disclose their future purchase plans. This is done by interviewing all consumers or a selected group of consumers out of the relevant population. This is the direct method of estimating demand in the short run.
Here the burden of forecasting is shifted to the buyer. The firm may go in for complete enumeration or for sample surveys. If the commodity under consideration is an intermediate product then the industries using it as an end product are surveyed.
(i) Complete Enumeration Survey:
Under the Complete Enumeration Survey, the firm has to go for a door to door survey for the forecast period by contacting all the households in the area. This method has an advantage of first hand, unbiased information, yet it has its share of disadvantages also.
The major limitation of this method is that it requires lot of resources, manpower and time. In this method, consumers may be reluctant to reveal their purchase plans due to personal privacy or commercial secrecy. Moreover, at times the consumers may not express their opinion properly or may deliberately misguide the investigators.
(ii) Sample Survey and Test Marketing:
Under this method some representative households are selected on random basis as samples and their opinion is taken as the generalised opinion. This method is based on the basic assumption that the sample truly represents the population. If the sample is the true representative, there is likely to be no significant difference in the results obtained by the survey. Apart from that, this method is less tedious and less costly.
A variant of sample survey technique is test marketing. Product testing essentially involves placing the product with a number of users for a set period. Their reactions to the product are noted after a period of time and an estimate of likely demand is made from the result.
These are suitable for new products or for radically modified old products for which no prior data exists. It is a more scientific method of estimating likely demand because it stimulates a national launch in a closely defined geographical area.
(iii) End Use Method or Input-Output Method:
This method is quite useful for industries which are mainly producers goods. In this method, the sale of the product under consideration is projected as the basis of demand survey of the industries using this product as and intermediate product, that is, the demand for the final product is the end use demand of the intermediate product used in the production of this final product.
The end use demand estimation of an intermediate product may involve many final good industries using this product at home and abroad. It helps us to understand inter-industry relations. In input-output accounting two matrices used are the transaction matrix and the input co-efficient matrix. The major efforts required by this type are not in its operation but in the collection and presentation of data.
(b) Sales Force Opinion Method:
This is also known as collective opinion method. In this method, instead of consumers, the opinion of the salesmen is sought. It is sometimes referred as the “grass roots approach” as it is a bottom-up method that requires each sales person in the company to make an individual forecast for his or her particular sales territory.
These individual forecasts are discussed and agreed with the sales manager. The composite of all forecasts then constitutes the sales forecast for the organisation. The advantages of this method are that it is easy and cheap. It does not involve any elaborate statistical treatment. The main merit of this method lies in the collective wisdom of salesmen. This method is more useful in forecasting sales of new products.
(c) Experts Opinion Method:
This method is also known as “Delphi Technique” of investigation. The Delphi method requires a panel of experts, who are interrogated through a sequence of questionnaires in which the responses to one questionnaire are used to produce the next questionnaire. Thus any information available to some experts and not to others is passed on, enabling all the experts to have access to all the information for forecasting.
The method is used for long term forecasting to estimate potential sales for new products. This method presumes two conditions: Firstly, the panellists must be rich in their expertise, possess wide range of knowledge and experience. Secondly, its conductors are objective in their job. This method has some exclusive advantages of saving time and other resources.
2. Statistical Method:
Statistical methods have proved to be immensely useful in demand forecasting. In order to maintain objectivity, that is, by consideration of all implications and viewing the problem from an external point of view, the statistical methods are used.
The important statistical methods are:
(i) Trend Projection Method:
A firm existing for a long time will have its own data regarding sales for past years. Such data when arranged chronologically yield what is referred to as ‘time series’. Time series shows the past sales with effective demand for a particular product under normal conditions.
Such data can be given in a tabular or graphic form for further analysis. This is the most popular method among business firms, partly because it is simple and inexpensive and partly because time series data often exhibit a persistent growth trend.
Time series has got four types of components namely, Secular Trend (T), Secular Variation (S), Cyclical Element (C), and an Irregular or Random Variation (I). These elements are expressed by the equation O = TSCI. Secular trend refers to the long run changes that occur as a result of general tendency.
Seasonal variations refer to changes in the short run weather pattern or social habits. Cyclical variations refer to the changes that occur in industry during depression and boom. Random variation refers to the factors which are generally able such as wars, strikes, flood, famine and so on.
When a forecast is made the seasonal, cyclical and random variations are removed from the observed data. Thus only the secular trend is left. This trend is then projected. Trend projection fits a trend line to a mathematical equation.
The trend can be estimated by using any one of the following methods:
(a) The Graphical Method, and
(b) The Least Square Method.
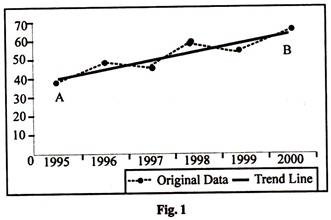
a) Graphical Method:
This is the most simple technique to determine the trend. All values of output or sale for different years are plotted on a graph and a smooth free hand curve is drawn passing through as many points as possible. The direction of this free hand curve—upward or downward— shows the trend. A simple illustration of this method is given in Table 2.

In Fig. 1, AB is the trend line which has been drawn as free hand curve passing through the various points representing actual sale values.
(b) Least Square Method:
Under the least square method, a trend line can be fitted to the time series data with the help of statistical techniques such as least square regression. When the trend in sales over time is given by straight line, the equation of this line is of the form: y = a + bx.
Where ‘a’ is the intercept and ‘ b’ shows the impact of the independent variable. We have two variables—the independent variable x and the dependent variable y. The line of best fit establishes a kind of mathematical relationship between the two variables x and y. This is expressed by the regression y on x.
In order to solve the equation y = a + bx, we have to make use of the following normal equations:
![]()
![]()
(ii) Barometric Technique:
A barometer is an instrument of measuring change. This method is based on the notion that “the future can be predicted from certain happenings in the present.” In other words, barometric techniques are based on the idea that certain events of the present can be used to predict the directions of change in the future. This is accomplished by the use of economic and statistical indicators which serve as barometers of economic change.
Generally forecasters correlate a firm’s sales with three series:
Leading Series, Coincident or Concurrent Series and Lagging Series.
(a) The Leading Series:
The leading series comprise those factors which move up or down before the recession or recovery starts. They tend to reflect future market changes. For example, baby powder sales can be forecasted by examining the birth rate pattern five years earlier, because there is a correlation between the baby powder sales and children of five years of age and since baby powder sales today are correlated with birth rate five years earlier, it is called lagged correlation. Thus we can say that births lead to baby soaps sales.
(b) Coincident or Concurrent Series:
The coincident or concurrent series are those which move up or down simultaneously with the level of the economy. They are used in confirming or refuting the validity of the leading indicator used a few months afterwards. Common examples of coinciding indicators are G.N.P itself, industrial production, trading and the retail sector.
(c) The Lagging Series:
The lagging series are those which take place after some time lag with respect to the business cycle. Examples of lagging series are, labour cost per unit of the manufacturing output, loans outstanding, leading rate of short term loans, etc.
(iii) Regression Analysis:
It attempts to assess the relationship between at least two variables (one or more independent and one dependent), the purpose being to predict the value of the dependent variable from the specific value of the independent variable.
The basis of this prediction generally is historical data. This method starts from the assumption that a basic relationship exists between two variables. An interactive statistical analysis computer package is used to formulate the mathematical relationship which exists.
For example, one may build up the sales model as:
Quantum of Sales = a. price + b. advertising + c. price of the rival products + d. personal disposable income + u
Where a, b, c, d are the constants which show the effect of corresponding variables as sales. The constant u represents the effect of all the variables which have been left out in the equation but having effect on sales. In the above equation, quantum of sales is the dependent variable and the variables on the right hand side of the equation are independent variables. If the expected values of the independent variables are substituted in the equation, the quantum of sales will then be forecasted.
The regression equation can also be written in a multiplicative form as given below:
Quantum of Sales = (Price)a + (Advertising)b + (Price of the rival products)c + (Personal disposable income)d + u
In the above case, the exponent of each variable indicates the elasticities of the corresponding variable. Stating the independent variables in terms of notation, the equation form is
QS = P0.8. A0.42 . R083. Y0.83. 40
Then we can say that 1 per cent increase in price leads to 0.8 per cent change in quantum of sales and so on.
If we take logarithmic form of the multiple equation, we can write the equation in an additive form as follows:
log QS = a log P + b log A + c log R + d log Yd + log u
In the above equation, the coefficients a, b, c, and d represent the elasticities of variables P, A, R and Yd respectively.
The co-efficient in the logarithmic regression equation are very useful in policy decision making by the management.
(iv) Econometric Models:
Econometric models are an extension of the regression technique whereby a system of independent regression equation is solved. The requirements for satisfactory use of the econometric model in forecasting is under three heads: variables, equations and data.
The appropriate procedure in forecasting by econometric methods is model building. Econometrics attempts to express economic theories in mathematical terms in such a way that they can be verified by statistical methods and to measure the impact of one economic variable upon another so as to be able to predict future events.
Project Report # 5. Criteria of a Good Forecasting Method:
There are thus, a good many ways to make a guess about future sales. They show contrast in cost, flexibility and the adequate skills and sophistication. Therefore, there is a problem of choosing the best method for a particular demand situation. There are certain economic criteria of broader applicability.
(i) Accuracy:
The forecast obtained must be accurate. How is an accurate forecast possible? To obtain an accurate forecast, it is essential to check the accuracy of past forecasts against present performance and of present forecasts against future performance. Accuracy cannot be tested by precise measurement but buy judgment.
(ii) Plausibility:
The executive should have good understanding of the technique chosen and they should have confidence in the techniques used. Understanding is also needed for a proper interpretation of results. Plausibility requirements can often improve the accuracy of results.
(iii) Durability:
Unfortunately, a demand function fitted to past experience may back cost very greatly and still fall apart in a short time as a forecaster. The durability of the forecasting power of a demand function depends partly on the reasonableness and simplicity of functions fitted, but primarily on the stability of the understanding relationships measured in the past. Of course, the importance of durability determines the allowable cost of the forecast.
(iv) Flexibility:
Flexibility can be viewed as an alternative to generality. A long lasting function could be set up in terms of basic natural forces and human motives. Even though fundamental, it would nevertheless be hard to measure and thus not very useful. A set of variables whose co-efficient could be adjusted from time to time to meet changing conditions in more practical way to maintain intact the routine procedure of forecasting.
(v) Availability:
Immediate availability of data is a vital requirement and the search for reasonable approximations to relevance in late data is a constant strain on the forecasters patience. The techniques employed should be able to produce meaningful results quickly. Delay in result will adversely affect the managerial decisions.
(vi) Economy:
Cost is a primary consideration which should be weighed against the importance of the forecasts to the business operations. A question may arise: How much money and managerial effort should be allocated to obtain a high level of forecasting accuracy? The criterion here is the economic consideration.
(vii) Simplicity:
Statistical and econometric models are certainly useful but they are intolerably complex. To those executives who have a fear of mathematics, these methods would appear to be Latin or Greek. The procedure should, therefore, be simple and easy so that the management may appreciate and understand why it has been adopted by the forecaster.
(viii) Consistency:
The forecaster has to deal with various components which are independent. If he does not make an adjustment in one component to bring it in line with a forecast of another, he would achieve a whole which would appear consistent.
Project Report # 6. Demand Forecasting in India:
Forecasting reduces the risk associated with business fluctuations which generally produce harmful effects in business, create unemployment, induce speculation, discourage capital formation and reduce the profit margin.
Forecasting is indispensable and it plays a very important part in the determination of various policies. In modern times forecasting has been put on scientific footing so that the risks associated with it have been considerably minimised and the chances of precision increased.
In most of the advanced countries there are specialised agencies. In India businessmen are not at all interested in making scientific forecasts. They depend more on chance, luck and astrology. They are highly superstitious and hence their forecasts are not correct.
Sufficient data are not available to make reliable forecasts. However, statistics alone do not forecast future conditions. Judgment, experience and knowledge of the particular trade are also necessary to make proper analysis and interpretation and to arrive at sound conclusions.