The below mentioned article provides an overview on the Output Extension Path (OEP).
To produce maximum output subject to a cost constraint or to produce a given output at a minimum cost, a firm will produce at that point where an isoquant is tangent to the isocost line, or where the slope of an isoquant is equal to the slope of the isocost line.
Thus, the point of tangency gives us the optimal input combination. While searching an optimal input usage, we assume that the costs of the firm, prices of inputs required to produce, etc., remain constant.
Now, we relax some of these assumptions. Suppose, monetary expenditure of the firm increases. Given prices of two inputs, isocost line will now shift up parallelly. If the producer decides to increase output following an increase in outlay the isoquant will shift up.
ADVERTISEMENTS:
Now, new points of tangency between the new isoquant and the new isocost line will give us the minimum cost and optimal input combination for successive levels of output. By joining these points of tangency we obtain a line called the output expansion path.
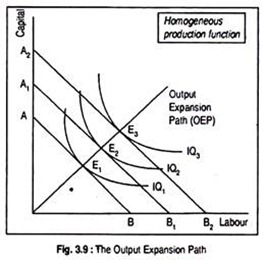
Fig. 3.9 illustrates the output expansion path which is similar to the income consumption curve of the consumer.
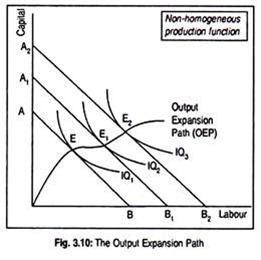
In Figs. 3.9 and 3.10, we have drawn three isoquants and three isocost lines. These two curves touch each other at points E, E1 and E2. Points E, E1 and E2 are the points of least- cost combination of resources. The line joining these points of tangency is called the ‘Output Expansion Path’ (OEP).
In other words, the locus of tangencies of isocost lines to isoquants gives us long run output expansion path (OEP) of a firm. An OEP shows how the optimal input usage changes with the change in output, if input prices do not change.
An OEP starts from the origin and becomes a straight line as drawn in Fig. 3.9. If OEP is a straight line, the production function is said to be linearly homogeneous (HGNS) or production function obeys constant returns to scale.
A straight line OEP tells us that factor proportions depend only on input price ratio, or factor proportions are independent of the level of output. This suggests that the rate of increase in physical output is the same as that of the rate of input proportions.
If production function is not a linearly homogeneous one, then OEP may take the shape of Fig. 3.10.
ADVERTISEMENTS:
The Output Expansion Path and the Varying Returns to Scale:
A short run production function gives us ‘laws of returns to a variable input’ while a long run production function gives us ‘laws of returns to scale’. One of the important phases of the law of returns to scale is the constant returns to scale. A firm can change its scale of operation when it increases all of its inputs in fixed proportion.
Then why should output increase by the same proportion? In other words, in the production process, there is no guarantee that the returns to scale will be unchanging. In fact, constant returns to scale are a temporary phenomenon that a firm might face. A firm in the production process may face actually varying returns to scale.
As the scale of production expands by combining fixed doses of labour and capital, the production function will initially show the increasing returns to scale; then, after a point, constant returns to scale and, finally, the diminishing returns to scale.
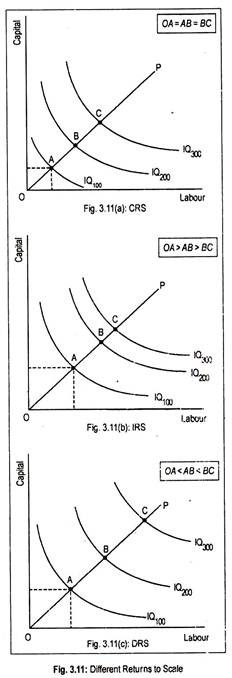
The constant, increasing and diminishing returns to scale have been shown independently in each of the three figures in Fig. 3.11 respectively. In Fig. 3.11(a), isoquants labeled as IQ100, IQ200, IQ300 have been drawn equal spaced. This means that the distance between isoquants along the ray OP is the same.
This means that if we increase L and K by 1, output will be 100, described by IQ100. Now if L and K increase by 2, output will rise to 200, represented by IQ200. Thus, the distance OA = AB = BC along the ray OP. This means production function obeys constant returns to scale.
Fig. 3.11(b) explains increasing returns to scale. This means that if inputs are doubled, output will be more than doubled. In diagrammatic term, we can say that the distance between successive isoquants declines (i.e., OA > AB > BC).
This amounts to saying that proportionate increases in inputs are required less to obtain equal increments in output. In this case, obviously, production function is said to be HGN3 of degree greater than one, provided the ray OP is a linear one.
Fig. 3.11(c) explains diminishing returns to scale. Returns to scale are said to be diminishing if equal proportionate increases in input causes output to expand less than that. Along the ray OP, the distance between successive isoquants rises (i.e., OA < AB < BC).
ADVERTISEMENTS:
This line suggests that larger proportionate increases in inputs are required to obtain an equal increase in output. Mathematically, such a production function is said to be homogeneous of degree less than one.


