
The following points highlight the four important theories of CAPM. The theories are:- 1. Random Walk Theory 2. Trend Walk Theory 3. Capital Asset Pricing (CAP) Theory 4. Modern Portfolio Theory.
1. Random Walk Theory:
This theory holds that no one can predict the prices of shares based on the past or historical trends. As the market is assumed to be efficient, all information is quickly absorbed in the prices, which move in a random manner and history does not repeat itself. The prices today do not depend upon the prices of yesterday. The prices have the equal capability of going up or down and it is therefore, impossible for an average investor to earn more than the average profits except by chance.
The prices move in a random manner depending upon the flow of information and any combination of shares is as good as any other combination to secure fair returns. For Indian conditions, where the markets are not perfect, Random walk model is less relevant than Trend Walk Theory.
2. Trend Walk Theory:
As opposed to the Random Walk Theory, the Trend Walk Theory postulates that the investor goes by the past trends and buys those which others are also buying. The trend is set by the so-called trend-setters and the investor follows the trends and is called the trend-walker. He goes by what he thinks is the trend set by the majority in the market. This behaviour is rational and justified by the logic that the market is determined by the past trends. The present is the offshoot of the past and the market absorbs the information imperfectly and as such random movements are not logical and consistent with reality.
ADVERTISEMENTS:
The market pattern is set by the majority and the trend-walkers follow the market trends on a day-to-day basis. In contrast to the Random Walk Theory, this theory is more realistic as the information flows are often incorrect and biased and the market absorption is imperfect. The early bird or the trend-setters who are the first to realise the changes or are better informed would start the trends in the market and generally they are the gainers. The trend-walkers are the average investors who may sometimes get beaten up in the market when the trends change suddenly against them.
3. Capital Asset Pricing (CAP) Theory:
Under this theory, the return on each security is related to the total risk inherent in that security. This risk is made up of systematic risk related to the market and unsystematic risk related to the company. If the risk is spread over a number of securities in the market, then the company-related risks are covered, reduced or eliminated. In a diversified portfolio, the unsystematic risk is eliminated but only the market-related systematic risk remains.
In this model, the return is the same on different portfolios, if they are diversified in the sense that the risk is reduced. The traditional theory that the higher the risk, higher the return is not true under this theory. The reward is related to risk and high risk scrips provide high returns under normal conditions. Under CAPM, even if a high risk security is clubbed with a low risk security, risk in total need not be increased but even reduced.
In the Capital Asset Pricing Theory, the company risk is eliminated and only the market risk remains. The market should be a free market with a large number of players who are influenced fairly and accurately by the demand and supply forces generated by the free flow of correct and perfect information. This information is digested by the market from time-to-time and the resultant prices are fair and competitive prices. Thus, the price of a share is determined as in an auction system and the market is the best performer and no individual can outperform the market.
ADVERTISEMENTS:
This model postulates that the company risk and the market risk are related by a variable called “Beta.”
The following equation for security valuation presents the concept of “Beta”:
(Ri – Rf) = Bi (RM – Rf)
where Ri is the rate of price appreciation on the scrip i (return on it).
ADVERTISEMENTS:
Rf = Risk-free rate or return.
RM is the market risk or average market rate of return and Bi is the constant, which relates the premium of the market rate over the risk-free rate to the company’s risk premium (Ri – Rf). While (Ri – Rf) is the risk premium of the i scrip (RM – Rf) is the risk premium of the market and these concepts are related by the multiplier named “Beta”, which is thus a measure of the company’s risk relative to the market risk.
4. Modern Portfolio Theory:
This theory is closely related to the above CAP Theory. Under this theory, the companies have different types of risks. These risks cannot be eliminated completely in any investment in shares on the stock market. But the investors are generally risk averse. They would like to choose a portfolio, which is least risky but with high returns. In the modern portfolio theory, the risk is reduced or eliminated by choosing companies in the portfolio whose covariance is negative, which means that they are not dependent upon the same economic variables.
Thus, companies manufacturing autos should be combined with companies manufacturing its competitive products like scooters, cycles, etc. In this context, it is necessary that one should classify the companies into those with positive covariance (complementary) and negative covariance (competitive). Industries and companies, which move differently to the same economic variables, should be chosen in a portfolio in order to reduce the risk.
The risk is of two types, namely, systematic risk (market related) and specific risk (company related). Systematic risk reflects the behaviour of individual scrip to the market sequence. Some shares move along the market more closely than others. This relative measure of volatility of individual scrip relative to the market behaviour is given by “Beta.”
Concept of Beta:
This concept of Beta as a measure of systematic risk is useful in portfolio management. The Beta measures the movement of one scrip in relation to the market trend. Thus, Beta can be positive or negative depending on whether the individual scrip moves in the same direction as the market or in the opposite direction and the extent of variance of one scrip vis-a-vis the market is being measured by Beta. The Beta is negative, if the share price moves contrary to the general trend and positive if it moves in the same direction.
The scrips which are having a high Beta of more than 1 are called aggressive, and those with a low Beta of less than 1 are called defensive. The portfolios with aggressive scrips will outperform the market. It is, therefore, necessary to calculate Betas for all scrips and choose those with high Betas for a portfolio of high returns. But aggressive scrips are also risky as they outperform the market in uptrend as well as downtrend and fluctuations are wide. If the B is 1.5, this security is more risky by 50% than the market portfolio. If B is 1, the risk of the security is the same as that of the market.
The calculation of “Beta” is explained below:
ADVERTISEMENTS:
The concept of B is defined commonly as that part of the variability of the return of a scrip which is relative to the overall variability of the market return.
The formula is Rj = a + Bj RM + u
Where Rj is the return on security j, RM is the return on market index, Bj is a measure of the risk, a is the intercept term and u is the error term introduced to estimate this regression equation. This model is commonly known as market model and Beta can be derived from the equation.
For example, if the risk free rate is 10%, the expected market return is 15% and B is 1.5, the expected return on the security should be worked out as follows:
ADVERTISEMENTS:
Risk free rate + B [expected return on market Portfolio – Risk free rate] = 10 + 1.5 (15 – 10) = 10 + 7.5 = 17.5%.
While the market rate is 15%, the rate on the security considered gives a larger return of 17.5%, as it is more risky than the market average.
Example of Beta Values:
In the Indian Stock Markets, the listed companies carry less risk than non-listed companies. Among listed companies the risk of specified shares is more than that of non-specified shares, due to larger speculation in the former category because of availability of carry forward facility, and margin trading. The variation between the high and low prices indicates the range of fluctuations, which is larger in general in the case of specified shares. The volumes and volatility of prices are also higher in their case.
ADVERTISEMENTS:
Beta values are calculated over a number of years and as such changes in any one year may not reflect the degree of volatility of a scrip. High risk and high volatility go together and that is seen in the case of speculative scrips like Reliance (with a Beta of 1.19) and TISCO (with a Beta of 1.13) which have got high Betas of more than one 1. But it is to be noted that even in non-specified shares, there can be high Beta values as in the case of D.C.M. (Beta of 1.41) and Gammon India (Beta of 1.33) for the simple reason that they turn out to be speculative due to some vested interests in those scrips (as estimated in 1999).
The Tables below present the data on selected Company Scrips, their prices in 1994 and 1996, their more recent 52 week High and Low prices and their Beta values; as published in the E.T. Investor’s guide (3-9 June 1996).
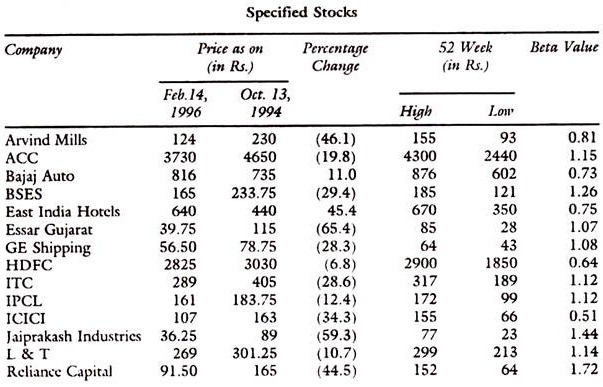
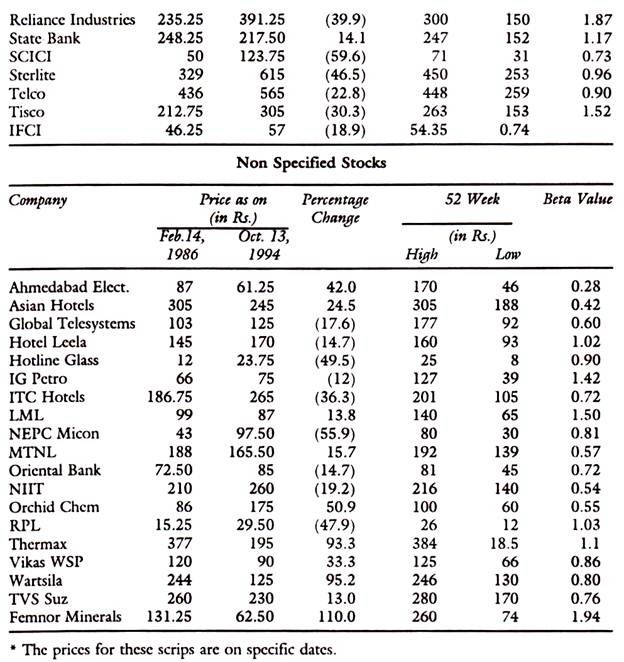
It is seen from the above Tables that there is no significant relation between volatility and Beta values and that Beta values of the past may not reflect the present or future volatility of prices. Such studies for any other time periods showed similar results.