
In this article we will discuss about the Market Structure:- 1. Subject-Matter of Market Structure 2. Conduct of Market Structure 3. Performance 4. The Structure-Conduct- Performance Paradigm 5. Economies of Scale.
Contents:
- Subject-Matter of Market Structure
- Conduct of Market Structure
- Performance of Market Structure
- The Structure-Conduct- Performance Paradigm
- Economies of Scale in Market Structure
1. Subject-Matter of Market Structure:
It has made an in-depth study of the theory and practice of commodity pricing and output determination under different market conditions — pure competition, pure monopoly and imperfect competition. We noted that the key determinant of market structure is barrier to entry. In other words, for an industry to remain concentrated or monopolized there has to be some way to close the market to entry.
ADVERTISEMENTS:
Here it suffices to note that unless some barrier exists and can be permanently maintained, the industry will tend to become more competitive because of the desire of each of the sellers to increase its market share by capturing more business.
In other words, so long as there are no significant entries barriers in an industry, competition will eventually come to dominate the market place.
In fact, in our entire discussion of market structure we have concentrated on two possibilities with regard to barriers to entry. We may recall that whenever there are no significant barriers, the industry will be regarded as competitive and the firms in the industry will be treated as price takers.
On the contrary, when there are significant barriers, the firms will be regarded as price makers (as in monopoly) or price searchers (as in oligopoly).
ADVERTISEMENTS:
The use of these three categories — price takers, price makers and price searchers — does not imply rejection of the traditional models of pure competition, monopoly, monopolistic competition and oligopoly. However, it forces us to consider how market structures change and evolve as barriers rise or fall.
2. Conduct of Market Structure:
Pricing policies of business firms are an important component of the firm’s conduct (i.e., their day-to-day behaviour).
The firm’s conduct depends on four major aspects of market structure, viz.:
ADVERTISEMENTS:
(i) The number of buyers and sellers,
(ii) The existence and degree of barriers to entry,
(iii) The existence of economies of scale, and
(iv) The degree of product differentiation.
3. Performance of Market Structure:
Conduct, in its turn, determines performance or the degree to which certain ideal macroeconomic goals are attained. The most important goal seems to be consumer protection. This demands elimination of unfair and restrictive trade practices.
However, in practice, there may be conflict between society’s economic goals and the goals of an individual firm. The traditional goal of the business firm is profit maximization and, for the time being, we are mainly concerned with this goal.
The market structure indirectly affects business conduct inasmuch as the components of market structure (such as the number of buyers and sellers, the firm’s influence over price etc.) determine, at least partly, the pricing strategy a firm can follow. Furthermore, a careful examination of the market structure can explain some of the divergence between the theory and practice of pricing.
Thus, it seems that the relationships among structure, conduct and performance are fairly complex.
4. The Structure-Conduct- Performance Paradigm:
ADVERTISEMENTS:
The word ‘paradigm’ refers to a framework for – analysis or a way of looking at a particular set of facts. The structure-conduct-performance paradigm (henceforth SCPP) provides a framework for the study of industrial organization. We can utilize this framework in managerial economics too, for examining the relationship between industrial structure and pricing.
Structure and Pricing:
We are basically concerned with the application of the concepts of pricing, production and cost to the relationship between the firms and the rules and laws within which the firm has to operate.
True enough, the SCPP seems to organize thinking on the proper performance goals for society, and the structure and conduct characteristics necessary to accomplish these socio-economic goals. Pioneering work in this area has been done by E. S. Mason and Joe S. Bain.
ADVERTISEMENTS:
The policy implications of the paradigm are of great significance. If, for instance, the government declares that the distribution of income and wealth in society should be equitable, excess (or super normal) profits that occur to a monopolist will not be treated favourably.
If concentration of wealth and economic power in private hands is considered to be injurious to the interests of society, explicit or implicit (i.e., overt or covert) oligopolistic co-ordination or collusion may be regarded as undesirable.
A clear understanding of the perceived goals of society as also their relationship to the structural characteristics, as well as day-to-day operations of the firm, may imply results that are diametrically opposite to society’s goals.
The SCPP presupposes the existence of a causal relationship from:
ADVERTISEMENTS:
(a) Structure to conduct, and from
(b) Conduct to performance.
However, structure, conduct and performance each possesses various attributes so that the chain of causation is not clearly in the same direction.
While the number of firms and the assumed pattern of interaction among them will influence the pricing policy of an individual firm, this policy as also other attributes of conduct, will exert influence on three major structural characteristics of markets such as economies of scale, barriers to entry, and vertical integration.
The interrelationships are undoubtedly complex and difficult to isolate. One major facet of the paradigm that bears real significance is the relationship, if any, between concentration and profits. Industries in which a few dominant firms account for a major portion of total output are often said to be concentrated.
If the conduct of concentrated industries resembles closely that of a monopolist, such industries would be expected to earn excess (or super-normal) profits. Thus, the monopoly profits are likely to be reduced, if not completely eroded, by structural changes.
ADVERTISEMENTS:
This view gets ample support from both the proponents and opponents of monopoly. But this view has to be evaluated critically. However, before we proceed further, we may have a close look at the following two dimensions of concentration.
(i) Aggregate Concentration:
Aggregate concentration refers “to the degree of control over economic activity exercised by the largest firms in the economy”.
This definition implies at least two things:
(a) Increasing control of the economy by large firms and
(b) A corresponding reduction in the role of the individual entrepreneur.
ADVERTISEMENTS:
Aggregate concentration is likely to affect pricing decisions in two ways:
(1) Prima facie, to the extent that there is harmony of interests among a few large firms, none of them will seek any price change that is likely to be injurious to others.
(2) Secondly, changes in aggregate concentration may lead to changes in market concentration that affect the firm’s pricing decision. It is to the concept of market concentration that we turn now.
However, one final point may be noted before we proceed further; the relationship between pure size and pricing behaviour is tenuous at best.
Empirical studies made so far indicate that “any firm selling a differential product has a degree of monopoly power irrespective of its size. The degree of pricing discretion in the market does not depend on absolute size but rather on the number of competitors and the assumed pattern of reactions among them”.
(ii) Market (Industry) Concentration:
ADVERTISEMENTS:
Market concentration refers to the degree of concentration within an industry rather than in the aggregate economic system. It provides a summary measure of the degree of monopoly power in an industry and, in this sense, enables us to measure the degree of imperfection in a market. It is well known that in most markets we have situations which lie between the two extremes of perfect competition and monopoly.
In perfect competition, an individual firm cannot affect the market pricing by unilateral action. Thus, the degree of price discretion available to a firm is zero, A monopolist, on the other hand, possesses complete control on the pricing decision.
But in the in-between cases, how do we measure the degree of imperfection of the market, i.e., the degree of price discretion available to a firm? Market concentration provides an answer to this question.
One type of measure of market concentration is obtained by calculating the percentage of the industry’s size accounted for by the largest few firms. In effect, this amounts to doing for particular industries what Prof. R. K. Hazari did for the private corporate sector in India as a whole.
In general, the size of a firm may be measured by the volume of its output or sales, the number of people employed in the firm, its share capital, its assets etc. However, this type of measure of market concentration suffers from the defect that it only provides us with a rough and ready measure of the degree of monopoly power.
How one to decide exactly how many large firms is are to be considered — 5, 10, 20 or some other number? Since all the firms in the industry are not considered, we do not get a complete picture of how the imperfection of market is spread over the entire industry.
ADVERTISEMENTS:
The other type of measure of market concentration is known as a summary measure. The two most commonly used summary measures of concentration are the Gini Coefficient and the Herfindahl concentration index.
We shall explain the concept of Gini Coefficient with reference to an illustrative data. In Table 20.1 we present hypothetical data regarding the sales volumes of firms in a certain industry in a particular year:

Column 1 of Table 20.1 gives the different size classes of firms. Columns (2) and (3) give the percentages of the number of firms in the different size classes and the percentages of their sales in the total sales figures of the industry. (For example, 10 percent of the total number of firms whose sales varied between 0 and 5,000 rupees, constituted 5 percent of the total sales of the industry etc.). Columns (4) and (5) give the cumulative percentages of sales and firms, respectively.
The cumulative percentage figures obviously increase monotonically. At the two extremes, zero per cent of firms make zero per cent of the total sales, and 100 per cent of the firms sell 100 per cent of the total output. If the cumulative percent of sales is plotted against the cumulative percent of firms we get a curve like the one shown in Figure 20.1. This curve is called the Lorenz curve.
The straight line OO’ is called the egalitarian line. Along this line, the distribution of the total sales of the industry among the firms would be perfectly equal. The smallest 10 per cent of the firms would account for exactly 10 percent of the total sales, the smallest 50 percent for 50 per cent of the total sales, etc.
The divergence of the Lorenz curve from the egalitarian line shows that the actual distribution is unequal. While the smallest 10 percent of the firms make only 5 percent of the total sales, the biggest 5 percent of the firms account for as much as 30 percent.

Thus, the more the Lorenz curve bows away from the egalitarian line, the more unequal is the distribution of sales among firms, i.e., the higher is the degree of market concentration. The area ODEF- GHO’, called the area of concentration, is taken as the measure of the divergence of the Lorenz curve from the egalitarian line, i.e., of the degree of market concentration.
The Gini coefficient (which serves the same purpose) is the ratio between the area of concentration and the area between the egalitarian line and the axes.
The reason for taking the Gini coefficient—rather than the area of concentration as the ultimate measure of the degree of concentration —is that the Gini coefficient, being a ratio, is a pure number while the area of concentration would depend on the exact scales to which the diagram is drawn.
For instance, if we had drawn Figure 20.1 on smaller scales, the two sides of the box would have been smaller and the area of concentration would have been smaller, too. As can be easily checked, the Gini coefficient does not depend on the scales of measurement in this sense.
The Gini coefficient varies between 0 and 1. In an industry where this coefficient is close to zero there is a negligible degree of market concentration. Where it is close to unity, the degree of concentration is very high.
The Herfindahl index, on the other hand, is obtained as the sum of squares of the ratio of firm size to industry size:
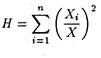
Where H is the Herfindahl index, Xi– is the size of the i-th firm and X is the size of the total industry. Obviously, H would vary between 0 and 1. In a perfectly competitive industry, the number of firms (n) is very large but each firm is of so insignificant a size compared to the industry as a whole that Xi/X is very small (close to zero) for each i.
Thus, the squared values are also close to zero. At the other extreme, in the case of monopoly, since there is only one firm in the industry, n = 1 and Xi = X. Thus, H would be 1. In general, the greater is the degree of concentration in an industry the closer to 1 would be the value of the Herfindahl index.
The summary measures of market concentration give reliable indications of the degree of concentration in a particular industry. They are watched closely by the appropriate authorities. However, these indices must be interpreted with care. (For instance, consideration of industrial growth may get mixed up with the phenomenon of concentration.
If one of the large firms in the industry increases its output while the other do not, there will be a rise- in the value of H indicating that there is greater concentration in the industry now. If keeping down the value of H is of overriding importance, the policy implication would be that the firm in question must be prevented from increasing its output. This obviously clashes with the objective of industrial growth.)
Social norms usually dictate that greater concentration is always a worse situation. Thus, if the ‘structure’ of the economy or of an industry gets more concentrated, the inference would be that the ‘performance’ of the economic system (or the particular industry in question) is worse than before.
There is, however, an implicit reference to ‘conduct’ also: the supposition is that, in a relatively concentrated economic structure, the firms actually adopt courses of action that are detrimental to the social interest.
For example, by keeping out prospective competitors And by putting up barriers to entry, the firms are probably preventing the economy from following the competitive model and, thereby, preventing the total output of the country from being less than what it could have been. Greater concentration is taken to mean worse performance.
We have noted that the concentration ratio or Gini coefficient measures the percentage of a given business activity (such as sales or production) accounted for by a fixed number of firms.
It is, therefore, quite logical to conclude that an industry with a concentration ratio of, say, 75% is more monopolised or concentrated than an industry with a ratio of, say, 50%. The concentration ratio undoubtedly provides some measure of the dominance by a small number of firms. But several problems crop up when this ratio is used as a measure of market power.
Firstly, the concentration ratio ignores the impact of potential competition on the industry. As Paul Samuelson has rightly commented, a non-firm concentration ratio could equal 100% (a pure monopoly). Vet, if monopoly profits exist, the market power of the monopolist could be non-existent due to the potential entry of new firms into the industry.
The second major problem with the concentration ratio is that it conceals changes that occur in an industry over time as a result of competitive pressures and technological advances. Thus, a concentration ratio for the computer industry, in which new firms are regularly joining the industry, appears to become less and less meaningful as new products and new firms are appearing.
A third measure of market concentration or monopoly power is the Lerner Index: The Lerner Index of monopoly power = (P – MC)/P where P is the price, and MC is the marginal cost of producing the commodity.
Essentially, the Lerner index focuses on the performance of a firm in exercising its monopoly power. The index is based upon the degree to which price deviates from marginal cost. The greater the numerical value of the index, the greater the degree of monopoly power. Thus, for instance, if MC = Rs. 6 and P = Rs. 10, the Lerner Index is (10 – 6)/10 = 0.4 or 40%. This implies that the mark-up above MC is equal to 40% of price.
This major drawback to using the Lerner Index as a measure of monopoly power or industrial concentration is that it requires the measurement of marginal cost which is a complex exercise. Moreover, to compute the Lerner Index across products and industries, it is necessary to quantify (or numerically measure) all qualitative aspects of a product.
5. Economies of Scale in Market Structure:
The shape of the long run average cost curve depends on economies and diseconomies of scale. At the early stages of the production process economies of scale are stronger than the diseconomies.
This is indicated by a decline in average cost in the long run as output expands. What is important here is that the magnitude of scale economies determines, at least partly, the size of individual firms and the distribution of firm sizes in a given market.
In the context of our framework of analysis it is necessary to draw a distinction between plant economies (i.e., economies of scale in a single plant) and firm economies (i.e., economies of scale at the multi plant or firm level).
The reason is easy to find. In fact, two modern economists have noted that the optimum size of the firm and the number of plants contained in it largely depends on the relative importance of these two classes of economies of scale.
Multi-plant scale economies arise from such things as the combined use of central facilities that may eliminate the need for duplication, lower marketing and distribution costs that result in cost saving from fewer external transactions.
If, for instance, multi plant scale economies are minimal, while the minimal efficient scale (MES), the point at which the LARC ceases to decline, occurs at a low level of output, then we would expect to observe a large number of single plant, rather than a few multi- plant, firms.
However, if there is the co-existence of both multi plant and single-plant economies of scale, an industry comprised of a small number of large, multi-plant firms would be observed. Thus, the prediction is that by helping to determine the number and character of the firms in an industry, single and multi-plant economies of scale influence the pricing decision.
The existence of scale economies invariably increases the profitable scale of operation of the firm. As economies of scale assume greater and greater significance, the firms that will operate in that industry are likely to be larger. Studies made by George Stigler and others indicate that economies of scale set a limit to the number of firms that may exist in an industry.
Since there is likely to exist a range of least cost scales of operation, one can expect a range of firm sizes above the minimum efficient scale, that is, the point at which the long-run average cost is minimum and does not decline further. So there is no further expansion of output by existing firms. Thus, the existence of economies of scale influences the size distribution of firms in an industry.
A related point may also be noted in this context. To the extent that there exists a relationship between absolute and/or relative size and pricing policies, a relationship is also likely to exist between scale economies and pricing policies. The latter relationship may now be explored further.
Barrier to Entry:
The existence of marginal firms (i.e., firms contemplating entering the industry) affect the pricing decisions of existing firms. Joe S. Bain has pointed out that the existence of barriers to entry such as economies of scale, product differentiation or absolute cost-advantages is, therefore, a very important determinant of a firm’s potential competition and thus of their pricing policies.
The term ‘barrier to entry’ refers to any attribute that permits existing firms to earn above-normal profits without inducing entry.
The importance of economies of scale and product differentiation (in the context of monopolistic competition) as actual, potential barriers to entry of new firms in the industry. We may discuss the third barrier, listed by Bain as absolute cost advantage, which refers to any cost difference that favours established firms.

Examples of absolute cost advantages are patents, control of sources of raw materials, goodwill, and access to cheaper sources of credit. In the context of SCPP, Bain has focused attention on the relationship between the decision of potential entrants to join an industry and the responsiveness of existing firms.
We may now illustrate, for the simplest case of absolute cost advantages, the degree by which prices can be raised without attracting new entry. In Figure 20.2, DD is the market demand curve for commodity, MCc the marginal cost of a potential entrant and MCs, that of a well-established firm. The assumption of central MC curves implies that MC = AC.
Then we can maximise profits directly from Figure 20.2. We further assume that there is a strong belief among potential entrants that established firms will maintain their output in the face of entry, and permit the entrants to capture any portion of the market they can.
The implication is that if the established firm initially charged price P1, the entrant perceives the demand curve to the right of A as their domain to exploit. If, for instance, the established firm produced Q2, the entrant would be able to exploit the demand curve to the right of point b.
Since MC = AC, if existing firms fix the price P1, the best possible optimum for an entrant would be to make zero profits at a zero level of output. If, however, established firms set a price above P1, there would surely exist the possibility of profitable entry. Thus, the prediction is that well-established firms raise prices above their own marginal costs by at most the difference in entrants’ and established firms’
MC, without attracting new firms into the industry. So long as established firms set a price in the range P1 and P2 entry is effectively stopped, provided we make the crucial assumption that entrants believe existing firms will maintain output in the face of entry.
Thus, one major conclusion that emerges from our discussion so far is that if entry barriers are really significant, they can prevent a response to excess profits and contribute to market power.
The second conclusion is that when entry barriers are substantial, the firms still retain a certain degree of pricing discretion. But if profits are abnormally high for a considerably long period of time there is the real possibility of a large firm from another industry being induced to enter the industry.
One final point should not be missed. When barriers to entry are moderate or low, the pricing decision of existing firms must be made in recognition of the fact that entry is comparatively easy.
Bain’s work has clearly indicated that various barriers to entry and market concentration affect rates of profits. The various types and degrees of entry account for varying rates of profits across industries. To be more specific, higher entry barriers and market concentration ratios have, in a large number of situations, resulted in high rates of profit.