The below mentioned article provides short notes on the isocost line.
The cost of production is the sum of all outlays on purchasing inputs required to produce. Such cost information can be available from the isocost line similar to the budget line discussed in the theory of consumer behaviour. An isocost line shows various combinations of two inputs—labour and capital—that can be bought for a given amount of expenditure.
Let us assume that a typical firm uses two inputs, L and K, whose prices are PL (or w) and PK (or r). These input prices (w and r) are given to the producer. Let ‘C’ be the total cost of production for employing different units of L and K.
We can represent all these information in terms of a straight line equation
ADVERTISEMENTS:
C = w.L + r.K
If the firm decides to purchase input K only, then, solving for K, we obtain
r.K = C – w.L
Dividing both sides by r, one obtains
ADVERTISEMENTS:
K=C/L – w/r .L
If the firm spends C which is given and r is the price of capital then C/r denotes the maximum amount of capital that can be bought. Thus, C/r the vertical or ordinate intercept, if capital is measured on the vertical axis of a diagram. The second-term, i.e., w/r, is the slope of the line or price ratio of the two inputs which is negative.
Similarly, if the entire ‘C’ is spent on buying labour, then the firm can purchase maximum amount of labour by the following amount.
Solving for L. one obtains
ADVERTISEMENTS:
L = C/w – r/w. K
Here C/w represents maximum amount of labour that can be bought. If labour is measured on the horizontal axis then C/w will represent the horizontal intercept. As usual, r/w is the slope of the equal cost line.
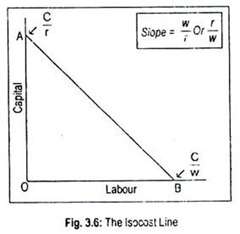
If we plot all these information on a graph paper, we obtain an isocost line, as shown in Fig. 3.6. We measure labour on the horizontal axis and capital on the vertical axis. Point B on the horizontal axis represents the maximum purchasable amount of labour with a given monetary outlay, if no capital is bought.
In terms of equation, point B is nothing but C/w — the horizontal intercept. Similarly, point A shows the maximum purchasable amount of capital if no labour is bought. Thus, point A is C/r— the vertical intercept. However, a firm purchases both of these two inputs.
Between points A and B, there are innumerable purchasable combinations of labour and capital. Now if all these purchasable combinations of inputs are joined together, we would obtain the isocost line (AB). Thus, an isocost line represents alternative combinations of labour and capital that may be purchased for a given monetary outlay.
An increase in monetary outlay would cause isocost line to shift in the upward direction. Conversely, there will be an inward shift of the isocost line if monetary outlay declines. These lines are called isocost or equal cost lines since costs remain the same throughout a particular line.
The slope of an isocost line is the negative of the price ratio. Thus, the slope of an isocost line AB is – OA/OB. We know that OA = C/r and OB = C/w. Therefore,
-OA/OB = C/r/C/w = – C/r. w/C = w/r
ADVERTISEMENTS:
Whenever there is a parallel shifting of the isocost line following a change in total expenditure then the slope of the isocost line would remain the same. However, a change in the relative input price will cause a change in the slope of the isocost line.
