
In this article we will discuss about the meaning and methods of security market analysis.
Meaning of Security Market Analysis:
The security market analysis refers to the analysis of markets and securities traded there in terms of the risk-return, quantities raised or traded, price trends and other indicators of the market referred to above. The market analysis is made in terms of fundamental macro factors in the economy and technical factors like price and volume trends in the market.
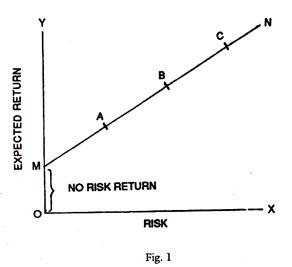
As regards the risk-return factors, the expected return varies with the risk attached to the instruments. Some instruments like government securities, P.S.U. Bonds or UTI units are least risky but have a cost in realisation. The cost of conversion or realisation of funds is zero in the case of bank deposits. The relationship between the risk and return in respect of various assets can be set out in macro terms as in Fig. 1.
A, B, C etc. are denoted to represent the various instruments with different combinations of risk-return characteristics.
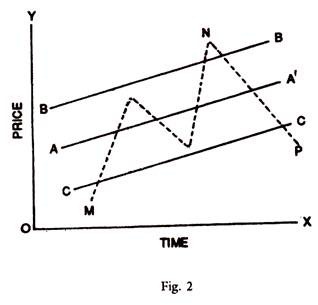
In respect of individual scrips in the market, the security is valued in terms of the returns or earnings it fetches. The valuation is, therefore, an important aspect of security analysis. The market price depends on the supply and demand forces but basically veers around its intrinsic value, which in turn depends on the financial performance and fundamental factors of the company. These inter-relations can be represented as follows in Fig. 2.
AA’ = Intrinsic Value. B and C provide the range of error around the intrinsic value. MNP is the actual price curve in the market.
Valuation:
ADVERTISEMENTS:
The basic objective of market analysis is to know the fair valuation of shares for buying and selling. The market comprises hundreds of securities whose prices change from day-to-day and from time to time. The investors should have information of fair prices for making their decisions of buying and selling. It is, therefore, necessary to make security valuation an important part of market-analysis. Besides, the trends of prices and volume of trading are inter-connected. Therefore, the market indicators of price, volume of trading, velocity of price changes and intensity of trading, etc. (volume of trading per hour) should all be examined together to have a correct picture of the market.
The valuation analysis in particular has two components, namely, the market valuation at the macro level and the individual security valuation at the micro level. The macro level analysis is done with the help of suitable price indices of the leading scrips in the market and their price-earnings ratio. Thus, the BSE National Index of Security Prices has 100 scrips in it and their P/E ratio represents the market valuation of the securities. These are published by the BSE on a daily basis.
As regards the individual security valuation, the intrinsic value is the basis on which overvaluation or undervaluation is judged. The intrinsic value is theoretically determined by the expected net earnings flows over a number of years discounted to the present time by a suitable discount rate. But in actual practice, this method is not followed due to the practical difficulties of forecasting the future earnings flows. Therefore, in practice, the P/E ratio is used to represent the payback period of a share or multiplier relationship of the price to its earnings per share.
There are theoretically three approaches to market valuation, namely, efficient market hypothesis, fundamental analysis and technical analysis. Under fundamental analysis, the share value depends on the intrinsic worth of the shares, namely, its earnings potential. If the efficient market hypothesis is used, then the market becomes perfect and the entry into the market by buyers at any time gives equal benefit to all.
ADVERTISEMENTS:
The prices are determined in a random manner by competitive forces and perfect information flow and are independent of the past prices. This information is not only free and perfect, but it is absorbed fully and immediately by the market. But in actual practice, the information flow is not free and perfect and markets are not, therefore, efficient.
Where the efficient market hypothesis does not hold, technical analysis is applicable. Under technical analysis, the prices move in a predictable manner and in waves and trends. The present prices are the result of past trends and an accordingly be predicted. Thus by the use of analytical tools of charts and curves, the price trends can be studied and future trends can be predicted to decide on when to buy and sell.
Methods for Security Market Analysis:
The Methods of Valuation are:
(i) Discounted Value of Future Income Streams or Dividends.
(ii) No. Of Years of Payback Period. (P/E Ratio).
(i) Discounted Value of Future Income Streams Compounding:
Take 5% interest rate and capital of Re. 1.
Compounding:
In one year, it becomes Rs. (1 + 0.5) = 1.05
ADVERTISEMENTS:
In two years, it becomes Rs. (1 + 0.5)2 = 1.1025
In three years, it becomes Rs. (1 + 0.5)3 = 1.1576
This method is called compounding. The reverse of the above is called discounting.
Discounting:
ADVERTISEMENTS:
If we receive Rs. 116 at the end of three years, and if it is discounted to the present day at 5%, it will be equal to Rs. 100 at present.
The present value of the principal of Rs. 100 at the time of maturity of 5 years at 8% return will be Rs. 100/(1 + 0.08)5 = Rs. 68.
The present value of Rs. 100, ten years hence, will be 39 at a discount rate of 10%.
The above principle will apply to bond valuation and debenture valuation.
ADVERTISEMENTS:
(ii) No. of Years of Payback Period:
(Capitalization or Multiplier approach to valuation)
For valuation of equity shares, the payback method is used in the form of P/E ratio.
Earning per share or dividend per share covers the price paid for a share in, say 5 years. For example, earning is Rs. 20 and the price Rs. 100. P/E Ratio is 5. Then the earnings multiplier is 5. The payback period is 5 years. The smaller is the period, the higher the return.
Theoretical Framework:
Investment refers to purchase of claims on money or financial assets used in the productive process in the economy. Investment, if it is in productive assets, should lead to an increase in output and income in the economy. In the macro sense, the investment income multiplier of Keynes operates whereby additional investment leads to an addition to output and income. Investment and income are related by a constant, namely, investment income multiplier or incremental capital-output ratio, which is the ratio of additional output due to the additional capital used in the productive process.
ADVERTISEMENTS:
Besides, the aggregate capital-output ratio should be distinguished from the incremental capital-output ratio. While the former relates to the output created through a given capital input, the latter refers to the incremental output generated through a given increase in capital input. Corresponding to these two concepts, there are aggregate investment multiplier and incremental investment multiplier. These refer to the increase in incomes due to a given increase in investment.
Mathematically, multiplier M = ΔY/ΔI where Y is income and I is investment. An increase in I (ΔI) will lead to a rise in Y (ΔY), as a multiple of I. This multiple is called investment multiplier by Keynes. A clear understanding of this concept will also explain the capital-output ratio. An increase in capital is investment itself while an increase in output as a result of an increase in capital input will lead to an increase in output and thus income in the macro sense.
If the incremental capital-output ratio is given by K, then the increase in output ΔO can be set out as follows:
ΔO = K x ΔI.
Thus, K = ΔO/ΔI, which is similar to the equation set out above for the investment multiplier.
Thus, the first theoretical tool is the Savings Investment Theory, which postulates that savings flow into investments which in turn lead to a multiple increase in output and income through what is called the capital-output ratio or investment multiplier. Thus savings promote capital formation and economic growth through increase in output and incomes of the country.
ADVERTISEMENTS:
The mobilization of savings for capital formation is through the capital market comprising the new issues market and the stock market. The role of capital market is thus primarily to promote economic growth. The instruments through which this process is carried out is through the sale of corporate and other securities, which are claims on financial assets.
These instruments are issued by the corporate sector to raise capital through such securities, as equities, preference shares, debentures, etc. The purchase and sale of these securities is carried on in the stock and capital markets, which impart liquidity to these investment instruments and thus promote the flow of public savings into these financial markets.
Secondly, the market behaviour also depends on the players and their role in trading. An analysis of the market price behaviour is thus possible through the number of buyers and sellers available and the free flow of correct and unbiased information into the market. The Capital Market Efficiency Theory, Random Walk Theory and many other theories explain how prices behave in the market in the macro sense. Competitive market conditions with a large number of buyers and sellers and with free and perfect flow of information will result in correct price formation in which prices tend to move near to their true intrinsic values of shares. In the absence of the above conditions, the share price movements may be erratic and biased; they may be overvalued or undervalued at any point of time.
The inside information, rumours, cornering of shares and semi-monopoly conditions would all lead to imperfections in the market and price formation would be unrelated to the prevailing fundamentals of the company and its shares. The theoretical analysis of the market for its price behaviour would enable the investor to understand the market and make the right investment decisions regarding corporate securities.
The third theoretical tool in investment analysis is the fundamental analysis which explains why prices are what they are. This is an analysis of fundamental factors affecting the market in the macro sense, namely, economic, industry and company analysis. In the micro sense, the price of a share can be analyzed through security valuation to find out the intrinsic value of a share and to examine whether a share is overvalued or undervalued.
In the security valuation the most important tool is the ratio analysis or examination of the balance sheet and profit and loss accounts of the company, whose share is being examined. The examination of these fundamentals will enable us to locate the undervalued shares and overvalued shares and to decide what shares to buy and what to sell.
ADVERTISEMENTS:
The next question is when to buy and when to sell. This leads to the fourth theoretical tool, namely, technical analysis, which is an analysis of the price behaviour of the aggregate market and of individual shares with the help of charts on price, trading volume and moving averages. An analysis of the price behaviour of the individual scrip historically in the background of the market price index behaviour will help to locate the turning signals indicating the likely changes in trends and suggesting the buy and sell points in the charts. The Dow Theory and Elliot Wave theory are some of the theories in this analysis, which explain the price behaviour in the past and help us forecast the likely behaviour in the immediate future.
Yet another type of analysis is the analysis of risk and return which are the two major characteristics of any investment. This is sought to be achieved by the use of portfolio theory and portfolio management. In the analysis, the choice of scrips is decided by an analysis of risks involved in relation to the return in the background of the market risks and market return. A diversified portfolio of scrips is decided by an analysis of risk involved in relation to the return in the background of the market risks and market return.
A diversified portfolio of scrips with varying degrees of risks in the upward and downwards directions would lead to a minimisation of risk for the selected basket of scrips in the market. The degree of risk of the whole basket would, of course, depend upon the asset preferences, income requirements and other investment characteristics which an investor would choose, given his likes, preferences, needs etc. Broadly the portfolio theory depicts the choice of scrips in terms of its risk-return characteristics and maximization of returns and minimisation of risks involved.
Schematic Presentation of Theory:
In Fig. 4, all the theories are integrated to help decision-making by investors. Firstly, the basis of markets is the money flow, which is represented by the funds flow theory, resulting in the emergence of stock and capital markets. Looked at from a different angle, the savings of the public are channeled into investment, which for an individual at micro level leads to claims on money and future cash flows. For the country as a whole, the savings flow into investment, which helps the growth process in the economy. This is explained by the Savings Investment Theory.
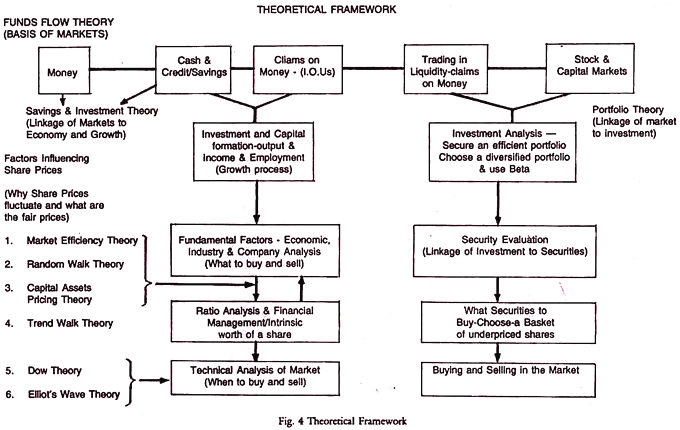
Secondly, an investor to make a right decision to purchase or sell shares has to know the correct and fair value of a share. To explain why share prices fluctuate and what the fair prices are, the theories used are Market Efficiency Theory, Random Walk Theory and Capital Assets Pricing Theory. All these present markets as efficient due to free and perfect information flows and their absorption by the markets. In actual practice, information is not perfect and markets are not efficient. Prices depend inter alia on a host of psychological and emotional factors. The theory of Trend Walkers explains the market trends as set by a few trend setters or leaders followed by a mass of trend walkers.
ADVERTISEMENTS:
Thirdly, the market prices and individual share prices are explained by the fundamental factors, namely, economy, industry and company analysis. This leads to factors determining the market prices and their movements around the intrinsic worth of the shares. This process is helped by the balance sheet analysis of companies and application of ratio analysis and other tools of financial management.
Fourthly, an investor should know the timing of investments, when to buy and sell. This decision is helped by the technical analysis of markets, incorporated in the Dow Theory and moving averages, Elliot’s Wave Theory, etc.
Lastly, the portfolio theory provides the linkage of markets to investment. An efficient portfolio is to be developed by the investor by making proper investments to minimise the risks and maximise the returns. The portfolio management helps the investment process by applying the principles of Portfolio Theory to build up an efficient portfolio through a diversified basket of scrips and by using the concept of Beta. Security evaluation and risk return assessment are linked to the investment process. What securities to buy and when to buy so as to build up an efficient portfolio are all interlinked to result in the buying and selling of shares in the market and trading.
Thus, the whole theoretical framework results in a practical application to the buying and selling and investment process in the market. The various theories are provided inter-linkages, inter se by the schematic representation in the Fig. 4.
Investment and Time Value of Money:
A bird in hand is worth two in the bush. Money today is more valuable than the same tomorrow or a few days hence. This is because money has alternative uses and opportunity costs. If it is invested, it would bring a return and better the investment, the better is the return. To part with money is a risk which should be rewarded by a return. The present value of a delayed pay off may be found by multiplying the pay off by a discounting factor, which is expressed as the reciprocal of 1 plus a rate of return. Thus the discounting factor = 1/1 + r, where r is the rate of return that investor thinks adequate for his parting with money. Money has also a psychological satisfaction and value and to part with money is to part with a value which can only be compensated by a return.
Present Value Method:
Thus the present value (PV) = 1/1 + r x C, where C is the expected cash flow or pay off in the period. If there are more than one period, then-
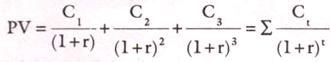
Where C1 , C2 etc-are returns periods 1 and 2 etc. and r remains as the same rate of return during all these periods. If r is the required rate of return or reward for the risk of parting with money and it remains the same throughout all the periods considered, and C1, C2, C3 etc. are the cash receipts in all the periods, then PV = C/r or PV X r = C. Thus, given the required rate of return, the needed cash flow can be derived.
In the above equation, r refers to the nominal return. The real return is the nominal return divided by the rate of inflation or rise in prices. Money is losing its value by the degree of inflation, year after year. In the eighties, the average rate of inflation per annum was around 8%, the real return is negative it is less than 8% and if r is 8%, then the real return is zero. Only if it is more than 8%, then the real return becomes positive.
Thus the return r, required to compensate the lender or investor of money, should give a minimum of inflation rate (or riskless return) plus a reward for risk for parting with liquidity. This reward for risk element varies from instrument, maturity period, the creditworthiness of the issuer of the instrument and a host of other factors.
In India, the Bank rate (9%) or the long-term rate of government securities (around 12%) could be considered the risk-free return and anything above this is the return for risk. Thus the rate of preference shares and fixed deposits is kept at 14% and the rate of PSU bonds (taxable) at 13%. The yield on equities should be definitely more than these rates as they are subject to higher risks. The debenture rates are left free to market forces since 1992.
D.C.F. (Discounted Cash Flows):
The present value of future flows should thus yield a return which includes a riskless return (for the degree of inflation) plus a return for the risk shouldered in the investment. The same can be understood as discounted cash flows of the future periods to the present period. Thus cash flows (C1, C2, C3, etc.) in periods 1, 2, 3 etc., should be discounted to the present period by the required rate of return (r) as shown below-
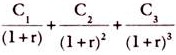
Assuming the cash flow of C1, C2, C3, etc. as constant (C) and the rate of returns is the same throughout the periods when these returns come, the present value can be set out as having a pay-off period of [PV/C], say, 6 to 10 years, depending upon the return of 15% to 10%. If the rate of return is 20%, then the pay-off period is 5 years. This concept of pay-off period shows how many years one has to wait to get back the present value of investment at the required rate of return. The shorter the period of waiting, the better is the investment. It is obvious that alternative investments have to be weighed before deciding on any investment.
Thus any two investments can be compared in terms of:
1. Actual rate of return above the risk-free return as compared to return on other similar assets;
2. Pay-off period;
3. Net present value which is equal to the present value of cash flows in future minus the actual investment in the present period (NPV).