
The following points highlight the seven things to know about the Meade’s model of Economic growth.
Things to Know # 1. Subject-Matter:
Prof. J.E. Meade in his book ‘A Neo-classical Theory of Economic Growth’ constructed model to study the process of equilibrium growth i.e. steady-state growth.
In fact, the model is designed to show the way in which the simplest form of classical economic system would behave during a process of equilibrium growth.
This model provides the relation to increase the income and population. It analyses the influence of income, capital, labour and technology on development. It also gives the conditions under which the growth of economy is possible. He tries to establish a relationship between population growth and income growth.
ADVERTISEMENTS:
Meade states three principles on which the economy grows. They are the following:
1. Capital accumulation resulting from the savings made out of current income.
2. Growth of working population i.e. growth of labour force.
3. Technical progress which allows more and more output to be produced by a given amount of resources.
ADVERTISEMENTS:
Prof. Meade in his model examined the behaviour of competitive economy during the process of equilibrium growth when real capital is being accumulated, labour force is growing and technical progress is accruing. Therefore he tries to incorporate these variable factors in classical model and to find out how the economy behaves under these conditions.
Things to Know # 2. Assumptions:
In constructing his growth mode, Prof. Meade assumes following assumptions:
1. The economy is classed as having no economic or financial relations with other countries.
ADVERTISEMENTS:
2. The production in the economy is assumed to take place under the conditions of perfect competition.
3. Complete Laissez-faire is assumed to prevail in the economy i.e. the economy is working under the conditions of constant returns to scale.
4. The economy is producing in two types of commodities- consumption goods and capital goods. The consumption goods satisfy all the human needs of consumption and the capital goods are used to produce capital goods.
5. Machines are the only form in which the capital is assumed.
6. The factors of production, land and labour are assumed to be in a state of full employment.
7. The money price of consumption goods is considered to be constant.
8. There are no State or Governmental economic activities involving taxation or state expenditure.
9. The production function can be substituted for one another. In a state of technical knowledge, it is possible to produce the consumption goods or capital goods by a more labour intensive method or a more land intensive method or by a more machinery intensive method, depending upon the availability of cheap labour.
10. The machines and labour are substituted for each other. It has been assumed that all machines are alike and can be altered in any desired way, both in short run and long run.
ADVERTISEMENTS:
11. It is also assumed that at every moment of time, the production function for a unit of consumption good is the same as the production function for a unit of capital good. This assumption is called Perfect Substitution in production between capital goods and consumption goods.
12. Each year, a certain percentage of machinery depreciates and needs replacement. This is called assumption of depreciation by evaporation.
Things to Know # 3. Determinants of Economic Growth or Explanation of the Model:
Meade examined the determinants of economic growth in a single product economy in which there is provision of substitution in production between capital goods and consumption goods.
In such an economy, the net output depends upon following factors:
ADVERTISEMENTS:
1. Net stock of machines.
2. Availability of labour force.
3. Amount of land or natural resources available for productive use.
4. The state of technological knowledge improves over time.
ADVERTISEMENTS:
Thus, the production is a function of the stock of capital, amount of labour, amount of land and level of technique.
This can be put as follows:
Y = F (K, L, N, t)
where Y = Net national income.
K = Existing stock of machines.
L = Amount of labour.
ADVERTISEMENTS:
N = Amount of land.
t = time over which technological progress takes place.
There are three ways to increase the volume in Y:
1. The stock of machines increases on account of increased savings. The increase in capital is denoted by K and it will increase the income or output by V∆K where V is the marginal physical product of a machine.
2. Y can be increased if there is increase in working population (L). If it grows by ∆L, then income or output will increase by W∆L where W represents the marginal physical product of labour.
3. The net output can increase, if technical progress takes place. If increase in net output, in one year due to technical progress is ∆Y’, the total increase in net output in one year is the sum of three influences.
ADVERTISEMENTS:
Therefore:
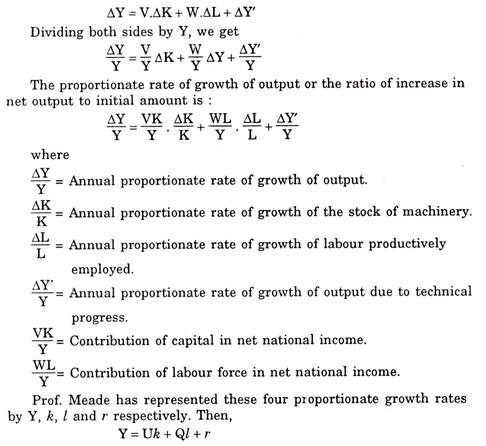
This shows that growth rate of output (y) is a weighted sum of other three outputs i.e. the sum of growth rate of capital (k) weighted by the proportion of national income going to profits (U) plus the growth rate of labour (I) weighted by proportion of national income going to labour as wages (Q) plus the growth rate of technical progress (r).
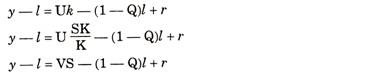
The above equation can be written as:
y — 1 = Uk — (1 — Q)l + r
Since y—I is the difference between the growth rate of total output and growth rate of working population i.e. it determines the growth rate of real income per head. For example, if total real income is increased by 9% per annum and the working population is growing by 6.5% per annum, then the income per head will be increased 2.5% per annum.
ADVERTISEMENTS:
The equation (i) states that “The growth rate in the real income per head is the outcome of three factors; First, it is raised by the growth rate in real capital (k) weighted by its proportional marginal product or by the proportion of the net national income which would be paid to profits in a competitive equilibrium (u).
Second, it is depressed by the growth rate in the working population (l) weighted by one minus the proportional marginal product of labour (1—Q) and third, it is raised by the rate of technical progress (r).
The second of these three elements which tends to depress the growth rate of real income per head is, of course, the familiar tendency for diminishing returns to labour to set in as more and more labour is applied to any given amount of land and capital equipment.”
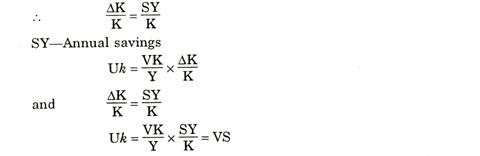
In order to introduce saving (s) in the above equation, uk can be written in another form also. Since it is assumed that all savings are invested, the addition to the stock of capital (∆K) will be will be equal to the savings out of the net national income (SY) x i.e. ∆K= SY.
“Which express in three forms the same thing, namely the contribution which capital accumulation is making to the growth rate of final output.”
ADVERTISEMENTS:
Thus, the basic relationship between the growth rate of real income per head can be expressed in following three ways:
To explain these equations having same results, Prof. Meade considers the numerical examples. Let us suppose the people save 1/10 of their income i.e. S = 1/10 and the marginal product of real capital or the market rate of profit is 5% per annum (V), then the contribution of capital accumulation to growth rate of output would be 1/2 per cent per annum.
In other words, if out of a year’s income of 1000, people save 100 units of product (S = 1/10)
and if once for all addition of 100 units to the stock machines increases annual output in every future year by 5 units (V = 5% per annum), then the initial annual income of 1000 will be raised by this year’s capital accumulation to 100 S or by 1/2 per cent in the course of the year (SV = y = 1/2 per cent per annum).
Now let us assume initial annual income to be 2000 and the initial stock of machines to be 4000, then Y = 2000 and K = 4000. If the stock of machines had increased by 5 per cent in the year, then U = VK/V
= 5/100 × 4000/2000 = 1 /10
and Uk = 1/10 x 5 = 1/2 per cent per annum
Thus, the contribution of capital accumulation to the growth rate of final output was of 1/10 of percent per annum or 1/2 per cent per annum.
The same result can be obtained by multiplying the proportion of national income going to profits (u), the proportion of national income saved (s) and the ratio of annual income to capital stocks (Y/K) i.e. US = Y/K.
Changes in the Rate of Economic Growth:
Meade had examined the conditions in which the growth rate is likely to be rising or falling over time. For this purpose, he analysed the factors responsible for changes in the rate of economic growth.
y = uk + ql + r
and y = us + ql + r
The growth rate of population and technical knowledge (l & r) are assured to be constant and exogenous over time. In this case, rising Y depends on whether uk (= vs) and q is rising. Let us take a special case where I = zero i.e. population is assumed constant. In this situation, the growth rate in the standard of living becomes
y = vs + r
If the rate of technical progress (r) is taken to be constant, then the rising and falling of y depends upon rising and falling of vs over time. Diagram 1 demonstrates this problem.
In the figure I, stock of machinery (K) is represented along X- axis and total annual output (y) along Y-axis. QQ1 is the production curve indicating the amount product in a year with given stock of capital. When the stock of machinery in one year is OD, then output of that year would be AD.
The slope of the curve at A measures the marginal product of machinery (here we have assumed that the rate of profit earned on a machinery is equal to the marginal product of machinery y). As a result, the slope of curve becomes less and less steep as we move towards right on the account of operation of the law of diminishing returns to machinery.
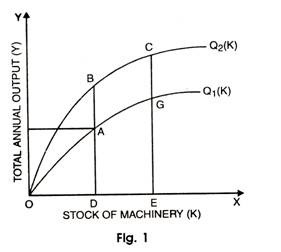
Now technical progress takes place and production possibility curve in the second year shifts from Q1 to Q2 which is higher than the previous curve. With the same amount of machinery i.e. OD, the output will be equal to DB. However, with the increase in the stock of machinery, OE from OD, the level of output will also increase to EG.
This shows that the level of output increases as the capital stock increases. The slope of the curve QQ1 at A is less than at the point G which indicates that the marginal productivity of capital at G is less than marginal productivity at A. The higher production curve QQ2 shows at higher level of output is possible with same capital stock provided technological improvements take place with the passage of time.
If the technical progress is neutral in its effect on machinery, the slope of Q2 at B will be greater then the slope of Q1 at A in the same proportion as BD is greater than output AD. If the slope of curve Q1 between A and B has risen by more than this, the technical progress is machine using and if it is less then it is machine saving.
Meade considers the following factors affecting growth rate of national income:
1. Since y = Uk + QI + r, anything which tends to raise the rate at which capital is being accumulated (k) will raise the growth rate of national product (y). The value of k can be increased by increasing the ratio of income to capital i.e. SY/K There are two things which can cause K to increase over time (a) the rise in the ratio of income to capital (y/k) (b) a rise in the proportion of income saved (S).
2. Technical progress can induce an increase in the growth rate of national product.
3. High elasticity’s of substitution between the production factors will increase the growth rate of national product and low elasticity’s of substitution will decrease the growth rate of national product.
4. If S itself is increasing, the rate of capital accumulation and the growth rate of national product will also tend to grow. S can be increased if real income per head from which saving can be made is increased or S might be raising due to change in the distribution of income.
Things to Know # 4. State of Steady Economic Growth:
Prof. Meade also examines the conditions of steady economic growth.
Therefore, the achievement of steady growth requires the existence of following conditions which will ensure a constant growth rate of total output:
1. All elasticities of substitution between various factors are equal to utility;
2. Technical progress is neutral towards all factors;
3. The proportion of profits saved, of wages saved and of rents saved are constant.
Considering these conditions, the growth rate of total output will always be more towards a given constant level, thus it represents a state of steady growth rate.
If the condition (1) and (2) are taken together, then it would mean that the proportions of national income going to profits (u) and wages (Q) and rents (Z) remain constant during the process of growth. In other words, it implies that U (marginal product of capital) and Q (marginal product of labour) would be constant. Second condition simply explains that technical progress does not influence U and Q.
Condition third requires more explanation. If Sv is the proportion of profit saved then Sv UY gives the amount of profit saved, since by represents total profits. Similarly SwQY and SgZY represents the amounts of wages and rents saved.
Hence, the total saving is the sum of the proportion of profits, wages and rents saved. Since the total saving as represented by SY are equal to the sum of the three components of saving, therefore;
SY = SvUY + SwQY + SgZY
S = SvU + SwQ + SgZ (cancelling Y from both sides)
The third condition shows that Sv, Sw and Sg are all constant. Condition I & II imply that U, Q and Z are all constant.
It follows that the ratio of total savings to total national income will also be constant. In this way, the whole discussion highlights the fact that a state of steady economic growth is possible when u, Q, Z, Sv, Sw and Sg are all constant
which means that ‘S’ is constant. Now the net rate of growth of output is given by the basic relationship i.e.
y = Uk + Ql + r
Since I and r are assumed to be constant and the condition (1) and (2) ensure that u and Q are also constant, Y will be constant if and only if k is constant, k will be constant if Y/K is constant. But Y/K will be constant if Y and K both grow at same rate per annum or if Y = K. Thus, the essential condition for steady growth is the equality between y and k i.e. growth of income must be equal to growth rate of capital stock.
Thus, the equality between y and k represents the equilibrium position. Any deviation from this position will either be due to excess or deficiency of capital accumulation.
Things to Know # 5. Critical Growth Rate:
There is a critical growth rate of capital stock which makes the growth rate of income equal to growth rate of capital stock. Therefore, the equilibrium position ultimately depends on the rate of accumulation of capital stock in an economy.
A higher or lower growth rate in capital than this critical growth rate will not equalise Y and K and the state of steady growth is not achieved. If the critical growth rate of capital stock is denoted by a, then we have
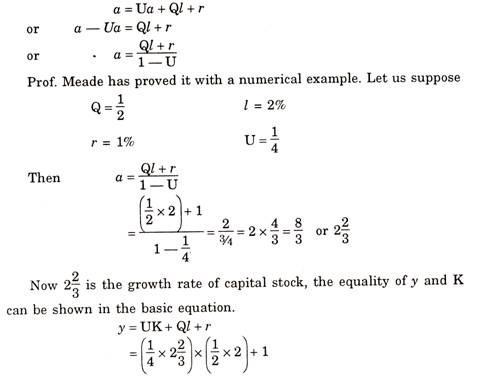

This numerical example is illustrated by Prof. J.E. Meade in his book ‘A’ Neoclassical Theory of Economic Growth’.
Thus, it represents that critical growth rate (a) is equal to Ql + r/1-U
If the growth rate of national income will also be Ql+r/1_ U and the growth rate of national output will be constant at this level.
This is a state of steady growth. If the growth rate of capital stock k (which is equal to sy/k) is greater or less than this critical level Ql +r /1-U then provisions are made to make it equal to Ql +r /1-U
Let us take an example by assuming that SY/K ˃ Ql +r /1-U
This x means that the rate of capital accumulation is greater than critical rate and this will cause the capital stock (k) to grow at a greater proportionate rate than income (y).
Therefore, as long as SY/K˃ Ql +r /1-U, y will be growing at a lower proportionate rate than k, Y/K will be falling and with S constant SY/k will also be falling. Conversely, if SY/K ˂Ql +r /1-U, then income would increase more quickly than the capital stock, savings would increase and so would the capital stock, as a result SY/k would rise towards the crucial level Ql +r /1-U, other words, If k starts above the critical steady growth level of Ql +r /1-U, the capital stock will grow more rapidly than income and as savings grow only in proportion to income, the ratio of savings to capital stock or the growth rate of capital will be falling towards critical level Ql +r /1-U.
Therefore, under the two assumptions and three conditions, the growth rate of national income and the growth rate of capital stock would both tend toward the critical growth rate of Ql +r /1-U.
Therefore, Prof. Meade concluded his steady growth as “If the growth rate of population were constant, if the three elasticities of substitution between the three factors land, labour and machinery were all unity, if technical progress were at a constant rate and neutral towards all factors, if the proportion of profits, wages and rents saved were all three constant then the growth rates of real income and land of stock of machinery would both tend toward a constant level equal to Ql +r /1-U.
Things to Know # 6. Steady Growth with the Help of Diagram:
The phenomenon of steady growth can be illustrated with the help of a diagram 2.
The growth rate of capital is shown on horizontal axis and national income on vertical axis. The line OCG is drawn through the origin with the slope CD/OD = GH/OH = u, the
proportional marginal product of machinery. The height of this line gives the part of the growth of national income which is due to the growth of stock of machinery and is equal to uk.

On the vertical axis OE = QI + r. This represents the growth rate of national income due to growth of population and technical progress. Through E, a line EAF is drawn parallel to OCG. The vertical distance of this line from X-axis gives the total growth of national income. In the diagram, the total growth is AD and;
AD = CD (uk + Ql + r) — CD (= uk)
AC = OE
OE = Q I + r
AC = QI + r
CD = Uk
Hence AD = QI + r + uk
Represents the growth rate of national income which is due to growth of the stock of machinery and AC (+ QI + r) represents the growth rate of national income which is due to the population growth and technical progress.
Now a straight line OBF is drawn at an angle of 45° through its origin so that the vertical distance of line OBF measures the growth rate of stock of machinery (k). The point F represents steady growth and at this point. In mathematically terms, derivation explains the value of two variables as;
GH = Uk = u,
FH = k
FG = FH — GH
= k — Uk
= k (1—u)
FG = OE = Ql = r
At point F
k (1—U) = Ql + r
k = Ql+r/1 —U
This is the required value to be assumed by y and k to achieve the state of steady growth.
Things to Know # 7. Critical Appraisal of Meade’s Model:
The main feature of Meade’s model is that it lays stress on effect of population growth, capital accumulation and technological progress in determining the growth rate of national and per capita income. This model also provides a deep insight into the mechanism of steady growth and the developing country like India who cherish to achieve it, could get a relief through it.
The steady growth is a replica ‘Golden Age’ termed by Mrs. John Robinson, used for steady growth in an economy.
Mrs. Robinson assumes two assumptions for golden age as, of full employment and full utilization of capital stock while Prof. Meade explains the same thing without having unrealistic assumptions. Mrs. John Robinson’s treatment is only tenable under these assumptions; thus Meade’s assumption is superior to her.
Despite the fact, Prof. Meade model ignores the influence of social, political and international forces in economic growth, it is based on unrealistic assumptions which lead to abstract theoretical structures. It is also criticised as this model is not applicable to under-developed countries.
As such, this model has the following weaknesses:
1. Unrealistic Assumptions,
2. Mathematical Model,
3. Neglects Investment Function,
4. Omission of Social and Institutional Factors,
5. International Forces not discussed,
6. Obsolete Theory,
7. Closed Economy,
8. Pseudo-Causal Relation,
9. Problem of Aggregation,
10. Lack of Empirical Evidence, and
11. No Place for Uncertainty.
1. Unrealistic Assumptions:
The foremost weakness of the model is that it assumes certain unrealistic assumptions such as perfect competition, closed economy, constant return to scale etc. These assumptions hold good only in static economy but they had no place in present modern era. In fact, it totally fails to solve the various development problems.
2. Mathematical Model:
The model presented by Prof. Meade is of mathematical nature which consists of number of equations of very complex relations which are difficult to understand. This has made the model only theoretical.
3. Neglects Investment Function:
This model is based on only production function and it does not consider investment function while there is a close relationship between them as production depends upon investment or vice-versa. In this manner, it fails to consider the rate of expectation. Thus, neglecting the investment function is a serious lacuna on the part of neo-classical model of Prof. Meade.
4. Omission of Social and Institutional Factors:
Another omission of the model is that Prof. Meade does not take into account the effect of social and institutional factors on development process. In other words, economic growth is greatly influenced by such factors as to finance risky ventures, risky business decisions etc. In the absence of these forces, it reduces to Mrs. Robinson’s Guase Model.
5. International Forces not discussed:
Meade’s model fails to discuss the rate of international forces in the process of economic development. In modern times, international relations between developed and under-developed countries influence the economic development to a greater extent. But these forces have not been included in the model.
6. Obsolete Theory:
According to Mrs. Robinson, thriftiness does not provide any guarantee to accumulation. In fact, investment decisions greatly depend upon entrepreneurial experience, fiscal and monetary policies of the government, socio-cultural factor etc.
7. Closed Economy:
Unlike other growth models of Harrod-Domar, Mrs. Joan Robinson, Prof. Meade’s model is also based on the unrealistic assumption of closed economy which is not convincing in the present dynamic world.
8. Pseudo-Causal Relation:
Prof. Meade model has been criticised as saying it pseudo-casual by Mrs. Joan Robinson. It is because it simply assumes that the operation of monetary policies keeps the prices of consumption goods constant and money wage rate ensures full employment. Thus, it is quite unrealistic to assume that the easing or tightening of monetary conditions could be carried out with all its foresightedness.
9. Problem of Aggregation:
Again, Mrs. Robinson observed that aggregate production function does not provide any information about marginal products of production factor. A given level of aggregate income can only represent quite different physical equipment’s. In other words, corresponding to a given incremental capital over given capital level exists no unique output increment. In fact, it creates the problem of aggregation.
10. Lack of Empirical Evidence:
The neo-classical model of Prof. Meade lacks empirical evidence which is must for the practicability or feasibility of any theory in real life.
11. No Place for Uncertainty:
Prof. Butterick has also criticized the model on the ground that there is no place for uncertainty in the model. The inter-relations of all the variables are certain. This detracts the model from reality and makes it a theoretical one.
Conclusion:
On the basis of above criticism, it is considered that neo-classical model is an exercise in futility. The chief merit of this model is that it demonstrates the simultaneous effect of population growth, capital accumulation, and technical progress on the growth rate of national income and per capita real income over time.
Prof. Meade’s model has captured only a patch of reality under certain limiting conditions. Thus, it leaves an ample scope for modification and improvement in it.