Let us make in-depth study of the performance of banking under the reform process.
Introduction:
The banking sector reforms have sought to increase efficiency and productivity of the banking system through enhanced competition.
At the same time these banking reforms have aimed at achieving social obligations such as increase in lending to the priority sectors such as small-scale industries and agriculture. A major achievement of banking sector reforms has been marked improvement in the financial health of banks as reflected in capital adequacy norms and improved asset quality.
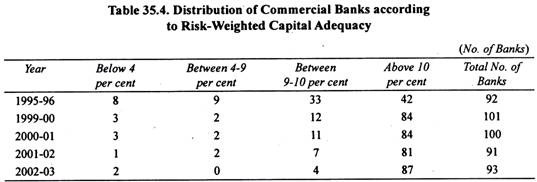
We give in Table 35.4 the distribution of commercial banks according to risk-weighted capital adequacy. Note that capital adequacy of a bank below 10 per cent reveals the risk of default by it and is therefore considered as financially unhealthy. As many as 50 commercial banks had risk-adjusted adequacy ratio below 10 per cent norm in 1995-1996, the number of such banks below 10 per cent capital adequacy norm came down to mere 6 in 2002-03. This is appreciable achievement.
Progress of Commercial Banking in India: 1969 to 2003:
After the nationalization of big banks in 1969 there has been rapid progress of commercial banking in India in terms of expansion of branches (especially in the rural and semi-urban areas), and growth of credit, especially for the priority sectors such as small scale industries and agriculture during the seventies and eighties.
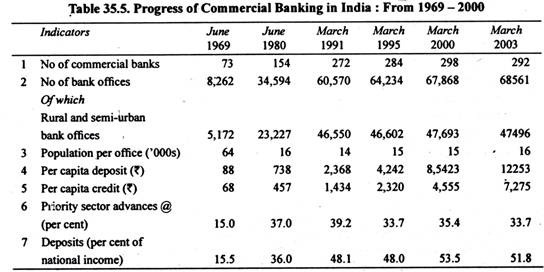
Under the financial reforms since 1991, as will be seen from Table 35.5, there has not been much progress in the expansion in number of bank branches (offices) and the number of population served by a bank branch which has remained at around 15,000. But, as rightly pointed by Rakesh Mohan, “the reform maintained the gains in terms of the outreach of bank branches achieved in the priority sector advances by banks” after nationalisation in 1969. Besides, banking reforms have led to the gains in terms of deposits per capita of population and credit issue per capita by banks.
Whereas deposits per capita rose from Rs. 2,368 at end-March 1991 to Rs. 12,253 at end-March 2000 – about 6 times increase, per capita credit rose from Rs. 1,434 at end-March 1991 to Rs. 7,275 at end-March 2003. Besides, deposits in commercial banks as per cent of national income increased from 48.1 at end- March 1991 to about 52 at end-March 2003.
An aspect of banking in respect of which there has been deterioration rather than progress relates to the lending to the priority sectors. It will be seen from Table 35.2 that there has been decline in priority sector advances which as per cent of total non-food credit of scheduled commercial banks fell from 39.2 per cent at end-March 1991 33.7 per cent at end March 2003. However, in the credit policy statement 2005-06 RBI has provided some incentives to the banks for providing more credit to the priority sectors such as agriculture and small and medium enterprises.
During the last three years (2003-06) due to revival and acceleration in industrial growth demand for bank credit by the commercial sector has increased and as a result the commercial banks are undertaking their core functions of providing loans and advances to the commercial sector to a greater extent. In fact, liberalisation of banking system and reduction in SLR banks seem to have struck a proper balance between investment and providing loans and advances as per their rational profit-maximising strategy.
Further Aspects of Progress of Commercial Banking in India, 2000 to 2009:
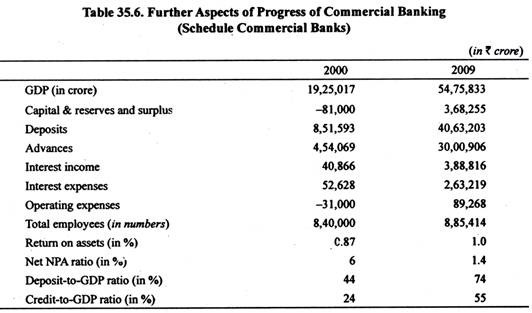
The commercial banking as measured by the amount of deposits in them and advances by them increased significantly between 2000 and 2009. As will be seen from Table 35.6. The total deposits in scheduled commercial banks (SCB) increased from 852 thousand crore in 2000 to 4063 thousand crore in 2009, that is, five times during these nine years, while advances by them grew from 454 thousand crore to 3000 thousand crore (see Table 35.6).
During these nine years interest income by SCBs increased by 9.5 times from 40.8 thousand crore to 38.8 thousand crore. However, number of employees in the banks increased very slowly from 840 thousand crore in 2000 to 885 thousand in 2009, that is, only by 5 per cent.
During 2000-09 our gross domestic product (GDP) nearly trebled from Rs. 19,25,000 crore to Rs. 54,75,000 crore, return on assets (RoA), which varies between 0.25% and 1.5% worldwide, rose from 0.87% in 2000 to 1.0 per cent in 2009 in India. At 1.4% in 2009 the net non-performing assets (NPA) ratio is a far cry from 6% level 10 years ago.
In contrast to most countries, in India, retail deposits form a sizeable chunk of gross domestic savings, creating a large potential for investment. The ratio of total deposits-to-GDP, which stood at 44% in 2000 climbed to 74% in 2009.
However, the credit-to-GDP ratio presents an opposite picture, and India with a credit-to-GDP ratio 55%, lags behind many countries whose banks lend more than the size of their economies. We also have to catch up with the world’s best-run banks in the area of cost management – at anywhere between 37% and 66% our cost-income ratio is no match for international bench marks of 30-35%.
The better performance of the banking system till 2009 as a result of financial reforms is reflected in greater efficiency and productively through enhanced competition. This has resulted in greater profitability of banks in the 1990s. The profitability of not only private sector banks but also of the public sector banks has greatly improved.
Thus, according to Rakesh Mohan, “public sector banks have responded to the new challenges of competition which is reflected in the increase in share of these banks in the overall profits of the banking sector. From the position of net loss in the mid-1990s, in recent years the share of public sector banks in the profits of the commercial banking system has become broadly commensurate with their share of assets, indicating a broad convergence of profitability across various bank groups.”
Increase in Non-Performing Assets (Bad Loans):
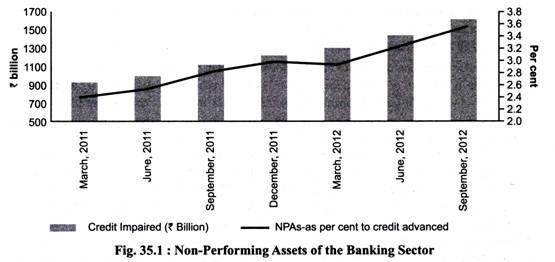
Because of the slowdown and high levels of leverage, banks are experiencing a rise in NPAs. Overall NPAs of the banking sector increased from 2.36 per cent of total credit advanced in March 2011 to 3.57 per cent of total credit advanced in September 2012 (Figure 35.1).
While there has been an across-the-board increase in NPAs, the increase has been particularly sharp for the industry and infrastructure sectors, with NPAs as a percentage of credit advanced increasing from 1.91 per cent in March 2011 to 3.44 percent as in September 2012. Sectors particularly under stress include textiles, chemicals, iron and steel, food processing, construction, and telecommunications.
As per RBI data, gross NPAs (GNPA) of PSBs have shown a rising trend during the last three years from Rs. 59,972 crore (March, 2010) to Rs. 71,080 crore (March, 2011), Rs. 1,12,489 crore (March, 2012), and Rs. 1, 44,437 crore (September, 2012).
ADVERTISEMENTS:
As a percentage of credit advanced, NPAs were at a level of 4.01 per cent in September 2012 compared to 2.09 per cent in 2008-09. Although GNPAs have increased at system level, the GNPA ratios of PSBs are still at manageable levels. However, given their rapid growth, albeit partly for technical reasons, they need to be closely monitored.
The main reasons for increase in NPAs of banks are:
(a) Switchover to system-based identification of NPAs by PSBs;
(b) Current macroeconomic situation in the country;
ADVERTISEMENTS:
(c) Increased interest rates in the recent past;
(d) Lower economic growth; and
(e) Aggressive lending by banks in the past, especially during good times.
Some recent initiatives taken by the government to address the rising NPAs include:
ADVERTISEMENTS:
(a) Appointment of nodal officers in banks for recovery at their head offices/zonal offices/for each Debts Recovery Tribunal (DRT);
(b) Thrust on recovery of loss assets by banks;
(c) Close watch on NPAs by picking up early warning signals and ensuring timely corrective steps by banks;
(d) Directing the state-level Bankers’ Committee to be proactive in resolving issues with the state governments; and
(e) Designating asset reconstruction companies (ARCs) resolution agents of banks.
Pursuant to the second review of the Monetary Policy, the RBI has also announced the following remedial measures:
ADVERTISEMENTS:
1. The provision for restructured standard accounts is to be raised from the existing 2 per cent to 2.75 per cent;
2. The sanction of fresh loans/ad hoc loans from 1st Jan 2013 will be made on the basis of sharing of information among banks;
3. Banks will conduct sector-/activity-wise analysis of NPAs; banks will put in place a robust mechanism for early detection of sign of distress, amendments in recovery laws, and strengthening of credit appraisal and post-credit monitoring.
Steps taken by the government and the RBI have resulted in improvement in recovery of NPAs by the PSBs which has increased from Rs. 9,726 crore as in March 2010 to Rs. 13,940 crore as in March 2011 and Rs. 17,043 crore as in March 2012.
Financial Performance of Banks, 2008-09 and 2009-10:
The consolidated balance sheet of the SCBs in India during 2009-10 showed relatively sluggish growth performance, marked mainly by slow deposit growth. The growth in profits of SCBs too was lower in 2009-10 than in the previous year. Further, there was a rise in the NPA ratio of SCBs in 2009-10. Though asset quality emerged as a concern for the banking sector, its capital adequacy remained fairly robust during the year, providing cushion for any future losses.
The overall growth in the consolidated balance sheet of SCBs in 2009-10 was 15.0 per cent which was lower than the 21.1 per cent during the previous year. Moreover the decline in growth could be seen across all bank groups with the notable exception of new private sector banks.
ADVERTISEMENTS:
The major factor contributing to the slowdown in growth of banks balance sheet was deposits. The growth in deposits of SCBs decelerated to 17.0 per cent in 2009-10 from 22.4 per cent in 2008-09. Further, credit growth constrained by a slowdown in deposit growth was placed at 16.6 per cent in 2009-10 as compared to 21.1 per cent in 2008-09. The deceleration in credit growth was accentuated on account of an overall slowdown of the economy in the aftermath of the global financial turmoil.
However, while bank credit growth witnessed a slowdown on a year-on-year basis, bank credit in general and credit to industry in particular showed distinct signs of recovery from October 2009 onwards as economic recovery became more broad based. The credit-deposit ratio at the end of March 2010 was 73.6 per cent, marginally lower than that at the end of March 2009.
There was an increase in the proportion of current and savings accounts (CASA) in 2009-10 in contrast to a declining trend noted in the recent past. On a year-on-year basis, the major drivers of non-food bank credit in 2009-10 were industry and agriculture. There was considerable slowdown in the growth in personal loans and also credit to the services sector during the year.
The growth in investments of banks decelerated to 18.6 per cent in 2009-10 from 23.1 per cent in 2008-09. Also, there were notable changes in the investment portfolio of banks. The percentage contribution of investments in approved securities declined in 2009-10 in contrast to an increase in 2008-09, which was mainly due to banks’ preference to park their funds in low-risk instruments against the backdrop of prevailing global uncertainties. Consequently, the percentage contribution of investments in non-SLR (statutory liquidity ratio) securities by banks showed an increase in 2009-10 driven mainly by an increase in investments in mutual funds.
Similar to the slowdown in growth in balance sheets, there was a moderation in the financial performance of SCBs in 2009-10. The growth in both income and expenditure of the SCBs slowed down leading to a deceleration in the growth of operating and net profits of SCBs. Every indicator of profitability also showed a decline in 2009-10.
The most salient indicator of profitability, return on assets (RoA), declined to 1.05 per cent in 2009-10 from 1.13 per cent in 2008-09. Further, return on equity (RoE) too declined to 14.3 per cent in 2009-10 from 15.4 per cent in 2008-09.
ADVERTISEMENTS:
After abstaining during 2008-09, banks started resorting to the capital market for raising resources in 2009-10. The resources raised from the capital market by banks were in the form of both public issues and private placement in 2009-10.
Financial Performance of Banks, 2010-11 and 2011-12:
Performance of Indian banks during the year 2011 -12 was conditioned to a large extent by fragile recovery of the global financial markets as well as a challenging operational environment on the domestic front, with persistent high inflation and muted growth performance. In addition, stressed financial conditions of some State Electricity Boards and airline companies added to the deterioration in asset quality of banks.
The consolidated balance sheet of SCBs grew at a slower pace during 2011- 12 as compared to the previous year due to slower growth of credit as well as deposits. In addition, net profit of banks slowed down. Though Indian banks remained well-capitalized, concerns regarding growing non-performing assets (NPAs) persisted.
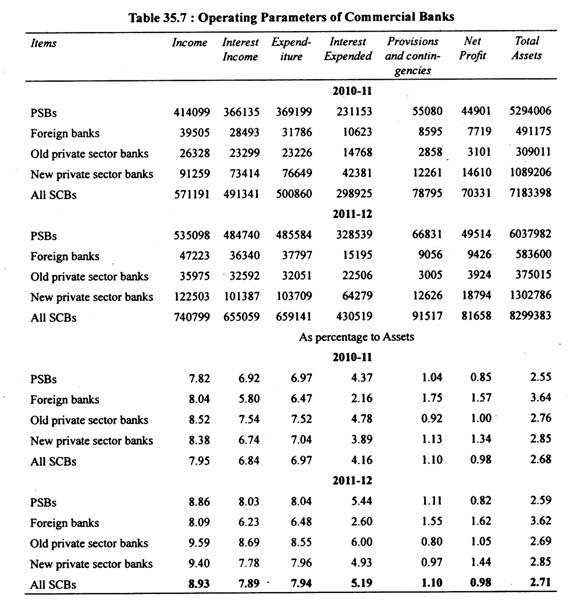
The operating performance of the SCBs as shown in Table 35.7 can be summed up as follows:
1. PSBs had a dominant share and accounted for 72 per cent of the total income of the SCBs and 72.8 per cent of aggregate assets.
2. In 2011 -12, there was a sharp increase in the expenditure on provisioning and contingencies; the rate of growth, however, varied across the bank categories. While contingency and provisioning expenses recorded a growth of 16.1 per cent for all commercial banks, the rate of growth was 21.3 per cent for PSBs and only 3 per cent for the new private sector banks. As percentage of PSB assets, the provisioning expenditure increased from 1.04 per cent in 2010-11 to 1.11 percent in2011-12.
ADVERTISEMENTS:
3. PSBs were able to increase their interest spread from 2.55 per cent in 2010-11 to 2.59 per cent in 2011 -12. The interest spread declined for old private sector banks and foreign banks. An increase in interest spread for all SCBs during 2011 -12 with a relatively moderate growth in credit disbursement is significant.
4. Net profit as percentage of assets remained sticky at 0.98 per cent in 2010 and 2011-12. However, in case of the PSBs, this declined from 0.85 per cent in 2010-11 to 0.82 per cent in 2011-12. Foreign banks and old and new private sector banks, however, were able to increase the ratio of net profit to assets.
Capital Adequacy Ratio (CAR):
One of the major indicators of growing financial soundness of the Indian banking system was the improvement in the capital to risk-weighted assets ratio (CRAR). The CRAR of all SCBs (Scheduled Commercial Banks) under Basel 1 framework improved to 13.6 per cent by end-March 2010 from 13.2 per cent a year earlier, thus remaining significantly above the stipulated minimum of 9.0 per cent.
As all commercial banks in India excluding RRBs (regional rural banks) and local area banks became Base I compliant as on 31 March 2009, it is also essential to look at the capital adequacy position under this framework. Under the Base II framework too, the CRAR of SCBs showed an increase in 2009-10; the CRAR improved to 14.5 per cent at the end of March 2010 from 14.0 per cent at the end of March 2009. At the bank group level, every bank group reported CRAR, on an average, of over 13 per cent under the Basel II framework.
Following the uncertainties prevailing in the domestic market and relatively subdued performance of the equity market during the first half of 2011 -12, banks abstained from raising resources through public issues during 2011-12.
During 2011-12, banks’ resource mobilization through private placements also slowed down as compared to the previous year. However, this reduction was seen in the case of PSBs, while private sector banks continued to raise resources through private placements.
The capital to risk-weighted assets ratio (CRAR) remained well above the RBI’s stipulated 9 per cent for the system as a whole as well as for all bank groups during 2011-12, indicating that Indian banks remained well-capitalized. Also, the CRAR at system level improved marginally compared to the previous year. The CRAR (under Basel II) at system-wide level stood at 14.24 per cent as at end-March 2012, as compared to 14.19 per cent as at end-March 2011.
As capital is a key measure of banks’ capacity for generating loan assets and is essential for balance sheet expansion, the Government of India has regularly invested additional capital in the PSBs to support their growth and keep them financially sound so as to ensure that the growing credit needs of the economy are adequately met.
A sum of Rs. 12,000 crore was infused in seven PSBs during 2011-12 to enable them to maintain a minimum Tier-I CRAR of 8 per cent and also to increase shareholding of the Government of India in these PSBs. In 2012-13 also, the Government infused capital in PSBs to augment their Tier-I capital so that they maintain their Tier-I CRAR at a comfortable level and remain compliant with the stricter capital adequacy norms under BASEL-III. This will also support internationally active PSBs in their national and international banking operations undertaken through their subsidiaries and associates. For this purpose an amount of Rs. 12,517 crore was allocated in the Revised Estimates (RE) 2012-13 under Plan.
In 2013-14, the Finance Ministry planned to infuse Rs. 14,000 crore in the public sector banks (PSBs) in the first quarter of 2013-14 but deferred its infusion plan till the next quarter as it wanted to assess their needs after the second quarter results before pumping cash to shore up their capital adequacy ratio (CAR). The Finance Ministry wants to assess the capital requirements of banks such as credit growth, non-performing assets, their recoveries, and profitability.
The Finance Ministry feels there’s no urgent need of capital infusion in banks and the government can take a call after the half-yearly results. Barring four, all other public sector banks are quite comfortably placed at 8% CAR, which is much above the required 6%, as prescribed by the Reserve Bank under the Basel III norms. The CAR requirement will increase by 50 basis points to 6.50% from March 2014.
The Finance Minister in his budget speech for 2013-14 has said that all banks with capital adequacy ratio of less than 8% will be given preference for capitalisation. Dena Bank has the lowest CAR at 7.26% followed by Bank of Maharashtra (7.57%), IDBI (7.68%) and Indian Overseas Bank (7.80%).
He had also said that banks will plough back retail earnings and also find other ways to raise capital. “We have asked banks to explore other options. In cases where government holding is more than 75%, both banks and the government will evaluate if options other than direct cash infusion can be explored.”
Sectoral Deployment of Bank Credit:
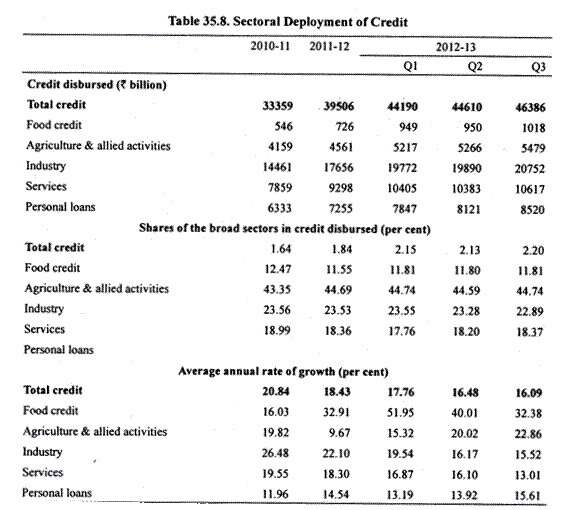
Details of sectoral deployment of credit are maintained by the RBI on a regular basis for 47 scheduled banks accounting for nearly 95 per cent of total credit flow. Industry has remained the dominant sector accounting for around 45 per cent of total credit disbursed by the banks. While food credit, primarily advanced for food procurement, has fluctuated, credit to the agriculture and allied sector has grown in percentage terms after Q3 of 2011 -12.
While the percentage growth of credit for the industry and services sectors has declined in 2012-13 growth in personal leans appears to have bottomed out and some recovery was visible in Q3 of 2012-13 (Table 35.8). Inflation affected the consumption of non-food items. Sectoral shares in the credit flow have generally remained stable.
Sectoral Deployment of Credit Indicates Deceleration across most Sectors in 2013-14:
An analysis of the sectoral deployment of credit based on data from select banks (which cover 95 per cent of total non-food credit extended by all SCBs) for June 2013 reveals that deceleration in credit growth was observed in all major sectors (viz., agriculture, industry and services), except for personal loans.
The y-o-y bank credit growth to industry moderated to 14.1 per cent in June 2013 from 20.7 per cent in June 2012. Deceleration in credit growth to industry was observed in all the major sub-sectors, barring food processing, textiles, leather & leather products, cement & cement products and infrastructure. Credit growth to industry excluding infrastructure was much lower, at 11.7 per cent in June 2013 compared with 22.4 per cent a year ago.
Despite a comfortable liquidity situation and a marginal decline in WALR during Q1 of 2013- 14. SCBs non-food credit growth remained below the Reserve Bank’s indicative trajectory. On the demand side, the deceleration in domestic growth adversely affected the demand for credit in India. The deterioration in credit quality, on the other hand, impeded the supply of domestic credit. The deceleration was observed across all bank groups, being high for PSBs and private sector banks, which jointly account for above 90 per cent of the SCB credit.
Risk Aversion Impacting Credit, as Asset Quality Concerns Persist:
Besides sluggish demand, a major factor that could have led to the low credit growth of public sector banks (PSBs) over the past quarters relates to deterioration in their asset quality. Asset quality indicators of the banking sector, which had suffered significantly during 2011-12, worsened in 2012-13.
Although data indicate worsening asset quality across bank groups during 2012-13, it continued to be led by public sector banks (PSBs), which account for the major portion of bank advances. Deterioration in both asset quality and in macroeconomic conditions resulted in risk aversion in the banking sector.
Priority Sector Lending:
In view of the need to ensure adequate institutional credit flow to the vulnerable sectors, the RBI has mandated that banks should lend a minimum of 40 per cent of their advances to the priority sectors. Priority sector broadly includes advances to agriculture, small scale industries, weaker section, exports, education, SHGs, etc.
Revised guidelines issued by the RBI on priority sector lending (PSL) on 20 July 2012 mandates commercial banks and foreign banks with 20 or more branches to allocate 40 per cent of their adjusted net bank credit (ANBC) or credit equivalent amount of off-balance sheet exposures (OBE), whichever is higher, to the priority sector. Within this, sub-targets of 18 per cent and 10 per cent of ANBC or credit equivalent amount of OBE have been mandated for lending to agriculture and the weaker sections respectively.
For foreign banks with less than 20 branches, the target PSL is 32 per cent of ANBC or credit equivalent amount of OBE, whichever is higher. Foreign banks have been given a period of 5 years beginning April 2013 to achieve their PSL target. Their action plan, however, is required to be approved by the RBI.
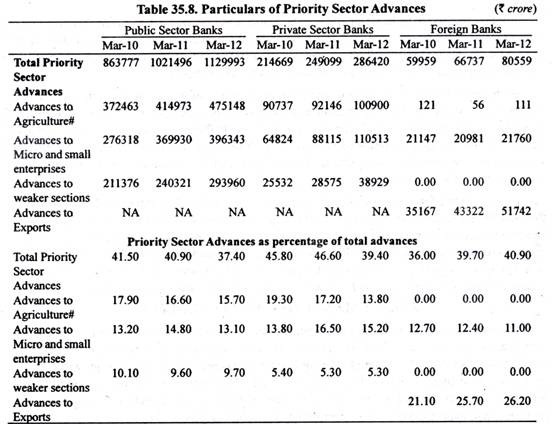
The total outstanding priority sector advances of public sector banks (PSB) increased from Rs. 10,21,496 crore as on the last reporting Friday of March 2011 to Rs. 11,29,993 crore as on the last reporting Friday of March 2012, showing a growth of 10.6 per cent. The achievement of PSBs as a group was 37.4 per cent as on the last reporting Friday of March 2012.
The outstanding priority sector advances of private sector banks grew by 14.9 per cent in 2011-12 and these were 39.4 per cent of their total advances as on the last reporting Friday of March 2012. The outstanding priority sector advances of foreign banks had reached the targeted level of 40 per cent as on March 2012, though these advances have largely been in export sector (See Table 35.8).
Technological Developments in Banks:
Banks in India are using information technology (IT) not only to improve their own internal processes but also to increase facilities and services to their customers. Efficient use of technology has facilitated accurate and timely management of the increased volumes of transactions of banks, consistent with a larger customer base.
Of the total number of PSB branches, 97.8 per cent were fully computerized at the end of March 2010. ATMs, particularly off-site ATMs, act as substitutes for bank branches in offering a means of anytime cash withdrawal to customers. Growth of ATMs, which had generally been steadily rising in recent years, was observed to be 37.8 per cent in 2009-10. More importantly, the growth in off-site ATMs too was comparably high at 44.6 per cent during the year. At the end of March 2010, the percentage of off-site ATMs to total ATMs stood at 45.7 per cent for all SCBs.
Another important technological development in 2009-10 was a significant increase in the percentage of PSB branches implementing CBS from 79.4 per cent at the end of March 2009 to 90 per cent at the end of March 2010. The percentage of branches under CBS (Computer Based System) was much larger for the SBI group as compared to nationalized banks.
With computerization in general, and CBS (Computer based system) in particular, having reached near completion, it is important to leverage this technological advancement to look at areas beyond CBS that can help in not just delivering quality and efficient services to customers but also generating and managing information effectively. With regard to the second aspect of information management, a system of receiving data from banks by the RBI in an automated manner without any manual intervention is under examination.
Going forward, there are a number of issues with regard to development of banking technology that need to be addressed. These relate to further improvement in back office management in the form of streamlining the management information system (MIS), strengthening centralized processing, customer relationship management (CRM), and IT Governance. Back office technological advancement would help divert banks’ resources more towards front office management, thereby increasing the customer focus of their services and supporting greater financial penetration and inclusion.
