The following points will highlight the nine things to know about cost-benefit analysis.
1. Subject-Matter:
The most popular method of project evaluation is to consider the cost benefit analysis of different projects and then to select involving lesser cost and yielding greater benefit.
The role of cost benefit is explained by Prof. Marglin as, “The perspective and Five year Plans determine the broad strategy of growth by allocating resources among sectors. But the strategy of growth embodied in the Plans leaves many tactical questions unsolved, and it is these tactical decisions that are the province of cost benefit cost analysis.”
It provides superior criteria for project evaluation in planned economy. It helps the planning authority in making correct investment decisions to achieve optimum resource allocation by maximising the difference between present value of benefits and costs of a project.
ADVERTISEMENTS:
Thus, cost benefit analysis “purports to describe and quantify the social advantages and disadvantages of a policy in terms of a common monetary unit.” The objective function can be expressed as Net Social Benefit (NSB)=Benefits—Costs, where benefits and costs are measured in terms of shadow or accounting prices of inputs and not of actual market prices.
2. Origin of Cost Benefit Analysis:
The origin of cost benefit analysis can be traced back to welfare economics of 19th century. The first practical embodiment of the maximization of net benefit occurred in 1930s in the realm of water resources. According to Flood Control Act of 1936, “The principle of comparing benefits to whomsoever they may accrue with the estimated costs.” This reveals unmistakably the social nature of the public investment decision.
The evaluation of federal expenditures in the field of navigation had been undertaken by the Corps of Engineers. The Green Book of 1950 produced by the Federal Inter-Agency River Basin Committee and the Bureau of Budget’s Budget Circular A-47 of 1952 made real attempt to instil order into the diverse and loosely defined cost-benefit criteria.
In the 1950s academic interest in the CBA analysis was also growing. The real turning point came, however in 1958 “with the simultaneous publication of works by Eckstein, Mckean and Krutilla and Eckstein”. These publications attempted “to formalise public investment criteria in relation to the established criteria of welfare economics.
ADVERTISEMENTS:
Thus benefits were related back to the consumers’ surplus criteria of Dupuit, Marshall and others, and ranking in terms of net social benefits was justified in terms of Pareto criteria for welfare maximisation.”
3. Welfare Foundations of Cost Benefit Analysis:
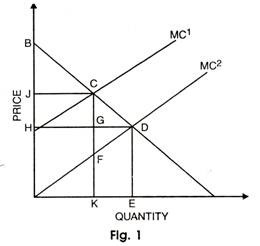
The aim of cost benefit analysis is to channel resources into projects which will yield the greatest gain in net benefit to society. Maximization of net benefit means the maximization of social utility. Dupuit examined this problem first in 1844. Let us understand his arguments in fig. 1, drawn under the assumption of perfect competition.
In Fig. 1, it is assumed that the undertaking of the project lowers the marginal cost from MC1 to MC2. Consequently, the market price is determined at D, the point of intersection of marginal cost with the demand curve BQ. At the new price, consumers are willing to pay OBDE for the quantity OE. The area OBDE consists of two parts—OHDE, the amount actually paid and HBD, the extra amount they are willing to pay, called Consumer’s Surplus.
ADVERTISEMENTS:
At C, the total price which the consumers were willing to pay was OBCK. So the change in the willingness to pay as a result of lower price is KEDC. In other words, the lower price increases gross benefits by the area KEDC.
The increase in benefits involves extra costs of KEDF. Hence the net gain in benefits is the triangle FDC. This triangle consists of two parts, GCD and GFD. GCD is the gain in consumer’s surplus whereas GFD is the gain in producer’s surplus.
Dupit suggested that the use of combined surplus in order to measure change in welfare arising from the imposition of a toll on a bridge crossing. But this analysis can be extended to the case of new investment.
Marshall later adopted consumer’s surplus concept to measure the change in welfare under the restrictive assumption of constant marginal utility of income. Other assumptions of this analysis were the cardinal indicators of utility gains and losses and identical utility scales for each person. Under these assumptions there was no problem in adding up individual surpluses and losses.
Cardinal utility came under severe attack at the hands of ordinalists. Hoteling and Hicks argued, that consumer’s surplus concept can still be retained by dropping the assumptions of cardinal utility and constancy of marginal utility of income.
Pareto described a state in which no one person could be made better off without someone else being made worse off. So if a change in economic organisation that makes everyone better off, or more precisely, that makes one or more members of society better off without making anyone worse off, is a Pareto improvement.
Since interpersonal comparison of utility is ruled out by ordinalists, Pareto optimum cannot analyse a situation in which a change benefits some persons and harms others. Moreover, Kaldor-Hicks compensation principle is an attempt to use Paretian optimum to explain this situation.
A change which produces gains that exceed in value of the accompanying losses is an improvement. In other words, a change increases social welfare if it is such that gainers can fully compensate all the losers and yet remain better off than before.
Welfare foundations of cost-benefits analysis, whether the consumer’s surplus approach or the Pareto optimum approach, are not of much value.
ADVERTISEMENTS:
They are based on a number of very restrictive assumptions. Consumer’s surplus approach, even stripped of its cardinal utility assumption, is useless on the ground, as indicated by Little, that the demand curve is only partial and fails to consider the effect of investment on the prices of all other goods.
Thus changes in surplus that may occur elsewhere are not taken into account in the analysis of the project in question.
Pareto improvement ignores the resulting change in the distribution of incomes. “Not only is it true that not everyone is made better off, it is also possible that those is the community who are made worse off are to be found largely among the lower-income group.” Suppose a change makes the rich better off by Rs. 3,00,000 at the expense of the poor who are made worse off by Rs. 2,00,000.
There is an excess gain of Rs. 1,00,000 for the society as a whole. But such an economic change which worsens the inequality in income distribution may not be acceptable to the majority opinion. Kaldor Hicks compensation principle is no solution of this problem since it considers only hypothetical payment to losers.
4. Application of Market Principle:
1. Maximization of Total Benefit-Fixed Budget:
ADVERTISEMENTS:
(i) Divisible Projects:
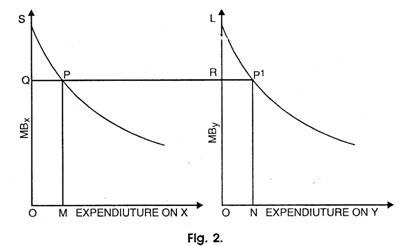
If we assume that projects are divisible, the task is simple when a unit of money is spent on project X, its opportunity cost is the benefit lost from not spending it on project Y, and vice-versa. Net benefit is the maximum when total benefits minus total costs are the highest. This is attained if MBx/MBy = MCx/MCy.
Let us suppose that a total sum of G is to be spent on two projects X and Y. If G is divided between them in such p way that OM is spent on X and ON on Y, total benefit is the highest since marginal benefit PM from OM equals marginal benefit PN from ON. It will be so under the assumption that MC is equal to one rupee and so MBx should be equated to MBy. It can be shown in fig. 2.
ADVERTISEMENTS:
In fig. 2, OM + ON = G the fixed budget. Total benefits from X are OMPS and those from Y are ONP1L. Marginal benefit from X is PM and that from Y is P1N and they are equal. Since MC in both cases equals rupee one. PM = P1N. Thus, the condition MBx/MBy = MCx/MCy is met.
(ii) Lumpy Projects:
In the case of lumpy projects, that is, allocation of funds between broad expenditure categories (e.g. between government departments), marginal approach is not applicable.
If we compare total benefits from each project and choose the most profitable ones or compare total benefits with total costs and select those whose net benefits are the highest, we cannot get the correct result because outlays on different projects are different.
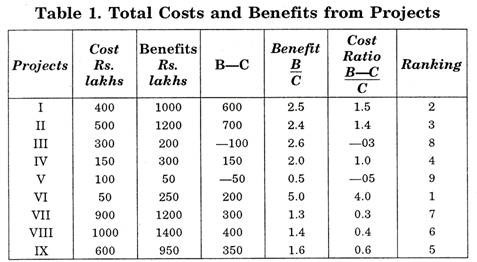
Hence we have to rank the projects on the basis of B/C ratio. An alternative approach is to rank the projects on the basis of B-C/C ratio—a ratio which gives a rate of return on cost. Rankings are the same in both the cases.
ADVERTISEMENTS:
In Table 1, cost for each project is measured by the rupee expenditure required. Benefit refers to the total benefit of each project. In terms of Fig. 2, the total benefit of project Y is the area ONP1L and it involves an outlay of ON. Cost and benefit of each project have been shown in similar ways in the above table.
2. Maximization of Total Benefits-Variable Budget:
In the case of variable budget, two problems must be solved. One relates to the determination of the size of the total budget and the other is concerned with the selection of public projects. In this situation the opportunity cost of public projects needs to be redefined in terms of the benefits lost from private projects which are foregone because resources are transferred to social use.
If public projects are divisible, the task is the maximization of net benefits (SIGMAB – ∑C), including benefits and costs of both public and private projects. This is attained when the marginal benefit for last rupee spent on public project equals that on private project. Since the marginal benefit from spending in the private sector equals Rs. 1, it holds for public sector as well.
Let us now take the case of lumpy projects. The B/C ratio in the private sector is taken to equal 1. The public project is undertaken if the B/C ratio exceeds 1, it, therefore, suggests that only projects I, II and VI in Table 1 will be undertaken.
Our aim above has been to show that the level of resource-using activities of the government and their allocation among different activities are determined by the same basic rule of optimum resource allocation which applies to the private sector of the economy. This is the equality of marginal social costs and benefits.
This rule requires that each government activity should be extended to that level at which the marginal social benefits from the activity equal marginal social costs. The marginal social benefits (MSB) are the gains to the members of the community as a whole from government expenditure.
ADVERTISEMENTS:
Marginal social costs (MSC) are taken as the benefits from private sector productions which are foregone due to the transfer of resources to the public use. The optimum level of each public activity is attained when MSB from all activities are equal to one another. The benefits to the society from the last rupee spent on education, for instance, must be the same as those from the last rupee spent on defence.
5. Financial Study and Cost Benefit Analysis:
While employing capital investment for production of an output, the decision is made on the expected return on investment. If such return is anticipated to be less than in other lines of production the particular product will not be able to attract capital from the investors.
In the case of public investment project, if the investment is made directly out of the proceeds from government exchequer, the planners assume the responsibility of making available adequate returns to the nation. In the case of private sector, investment involves such a commitment to the stockholders in the form of dividends.
Thus, time element is a prominent factor for investment fund, since it involves sacrifice of present consumption and waiting for future consumption. An individual will sacrifice his present consumption against a promise of enhanced future consumption in accordance with what is called his time preference.
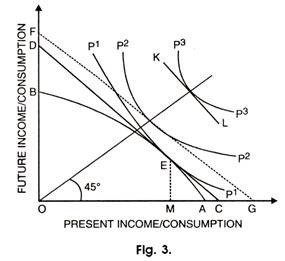
If he is indifferent as between one rupee worth of present consumption and one rupee ten paise worth of consumption one year hence, the rate of his marginal time preference is 0.10 or 10 per cent. This fact can be explained with the help of fig. 3.
In fig. 3, curve shows possibility of capital productivity or investment opportunities. The slope of the curve at different points or what is technically called Marginal Rate of Transformation (MRT) indicates the rate at which present income can be transformed into future income.
ADVERTISEMENTS:
Thus, at point E the rate is given by the slope of the line DC indicating that the present income of the amount AM can be transformed into future income of the amount EM.
The greater the sacrifice of present income, the larger will be the amount of transformed future income. But the rate of returns from sacrificing present income is diminishing and hence is the transformation curve concave to the point of origin.
On the other hand, marginal rate of time preference of the individual is given by the slope of his indifference curve for present consumption and future consumption. It indicates the rate at which he is ready to sacrifice present consumption against an assured amount of future consumption.
If at a point of indifference surface the slope indicates larger present consumption than future consumption, the marginal rate of time preference will be negative as shown by P3 schedule with KL slope. In the reverse case as indicated by the slope line DC at point E of indifference schedule P1 the rate will be positive while GF slope of P2 speaks of neutral preference or zero rate.
The marginal rate of time preference and the marginal rate of transformation are equal at point E where the preference and transformation schedules are tangent to each other. At this point, the rate of interest in private economy is determined.
6. General Conditions for Cost Benefit Analysis:
The project selection must be made on cost benefit analysis to formulate optimal development plans. The first step of project evaluation is to consider a list of cost and benefits of a project. It depends upon the nature of the project. The social benefits of a project include the contribution that the project would make to the attainment of national goals.
7. Criteria for Cost Benefit Analysis:
There are four benefit cost criteria discussed by the US Sub- Committee on benefits and costs.
They are:
(i) B—C
(ii) B—C/I
(iii) ∆B/∆C
(iv) B/C
Where B—Benefits, C—Costs, I—Direct Investment, ∆—Increment
The formula B—C/I is “for determining the total annual returns on a particular investment to the economy as a whole irrespective of to whom these accrue”. If the private investment happens to be very large, then even high value of B—C/I may be less beneficial to the economy. Thus, this criterion is not much useful to achieve satisfactory results. The another criterion of ∆B/∆C is meant to determine the size of project.
The adoption of the B—C criterion favours a large project and makes small and medium size projects less beneficial. Thus, this criterion helps in determining the scale of project on the basis of the maximisation of the difference between B and C. The best and most effective criterion for project evaluation is B/C.
In this criterion, the evaluation of project is done on the basis of benefit-cost ratio. If B/C=1, then the project is marginal because the benefits occurring from the project just cover the costs. If B/C, then benefits are less than costs-so the project is rejected. If B/C=1, the benefits are more than costs and the project is profitable and hence, it is selected. The higher the benefit cost ratio, more profitable will be the project.
The criterion discussed above does not account for the time factor. In fact, the future benefits and costs cannot be treated at par with present benefit and cost. Therefore, project evaluation requires discounting of future benefits and costs because society prefers present to the future. For this purpose, the economists have derived a number of decision rules or criteria.
They are discussed below:
1. The Net Present Value (NPV) Criterion:
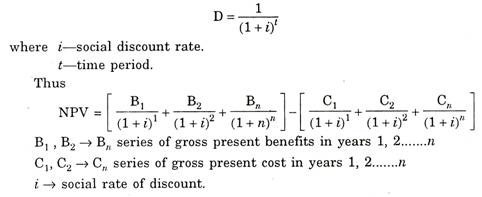
This is an important criterion for project evaluation. NPV=Present value of benefit—Present value of operating and maintaining costs—Initial outlay. It is also expressed as the net present value of benefits criterion so that,
NPV of benefit = Gross present value of benefits—Gross present value of costs.
If NPV > O then the project is socially profitable. If there are number of mutually exclusive projects, then the project with the highest net present value of benefits will be chosen.
The NPV criterion is not accurate method for project evaluation as it neglects the time horizon. Capital investments give benefits after a lapse of some time. Therefore, future benefits and costs cannot be equated with present benefits and costs. So it becomes essential to discount future benefits and costs because society prefers present to future.
The discount factor is expressed as:
Only those projects should be selected in which present value of benefits exceeds the present value of costs i.e.
The ratio of present value of benefit to present value of cost should be greater than 1 for the selection of a project i.e.
2. The Internal Rate of Return Criterion:
The criterion refers to the percentage rate of return implicit in the flows of benefits and costs of projects. Margin defines the internal rate of return (IRR) as the discount rate at which present value of return minus cost is zero. The mathematical formula for the computation IRR is (IRR)
In case of mutually exclusive projects, the project to be selected must have highest rate of return.
But this criterion has certain limitations which are given below:
1. It is not possible to change the rate of return assumed for the calculation of profitability of project.
2. It is difficult to calculate rate of return on long gestation project which does not yield benefit for many years.
3. This criterion is not applicable to highly capital intensive projects.
4. It is difficult to calculate IRR in which the entire investment outlay cannot be made in first period.
5. The use of IRR for public investment does not lead to correct decisions because it is not possible to discount intermediate benefits and costs of public investment at internal rate of return.
6. It is difficult to make choice between two alternative investments on the basis of their alternative internal rates of return.
7. Layard points out the problem of capital rationing where projects cannot be selected on the basis of ranking in order of the rate of return. Such projects can only be selected on the basis of their net present value.
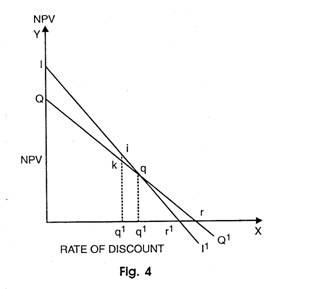
In fact, IRR depends upon social rate of discount. The choice of project depends upon discount rate if net present values of the projects are given. This can be explained with the help of a diagram 4.
The rate of discount is measured along X-axis and NPV on Y-axis. The curve II1 depicts investment of project I and QQ1 of project Q. The IRR of project Q is higher than of project I because discount rate or is greater than Or1. At Oq2, the IRR of both projects are equal. But if discount rate falls below Oq2, project I will be chosen because its NPV is higher by ik. The choice on the basis of changes in discount rate is called Switching and Re-switching.
Relation between NPV and IRR:
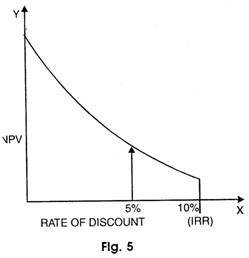
The NPV at the social discount rate and the internal rate of return are two criteria which are frequently used for choosing projects. The relation between NPV and IRR is illustrated with the help of a diagram 5.
As NPV falls, the discount rate increases and a situation arises when NPV becomes negative. The rate at which NPV changes from positive to negative is IRR. For the selection of project, the IRR must be higher than its discount rate i.e. r > i.
In the above figure, IRR is taken as 10 per cent be selected for development so long as NPV > O and r (10 per cent) > i (5 per cent). For complex projects, these two criteria can give different results but mostly they are interchangeable.
NPV criterion is commonly used for project evaluation in private and public sectors. But the NPV criterion is technically superior, since IRR can give an incorrect result in special circumstances.
3. Social Rate of Discount (SRD):
Since society prefers present to future, so future generations are likely to have higher levels of income. If the principle of diminishing marginal utility operates, then the utility gains to future generations from a given amount of benefits will be less than the utility gains to the present generations so the future gains must be discounted.
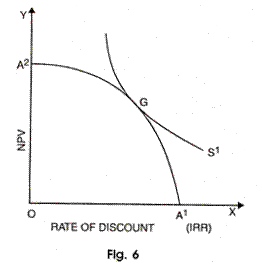
The rate at which future benefits must be discounted to make them comparable with present benefit is called ‘Social Rate of Discount’. In other words, it is the rate of premium which the society puts for preferring the present consumption to future consumption. This is illustrated with the help of a diagram 6 given.
The present consumption A1 is taken along horizontal axis and future consumptions A2 taken along vertical axis. A1A2 is the transformation frontier or investment possibility curve. It consists of a series of projects arranged from right to left in order of their rate of return, the cost of sacrifice of present consumption and the return is the gain of consumption in future.
The society will choose from the various investment possibilities so as to reach its highest social indifference curve SI, The society reaches an optimal position when transformation curve A1A2 equals its social indifference curve SI at point G.
The slope of the transformation curves represents the rate of return on investment and the social indifference curve represents the rate of time preference. Thus, social discount rate is determined by the equality of the rate of return on investment and rate of time preference at point G.
The social discount rate is constant over time. “A discount rate of 5 per cent might well lead to twice as much investment as one of the 10 per cent together with equivalent reduction in consumption.” If the discount rate is high, short period projects with higher net benefits are preferred. On the contrary, when the discount rate is low, long period projects with lower net benefits are selected.
Since the benefits and costs are to occur in future, they are discounted in order to find their present net worth so there is a problem of choosing suitable rate at which future benefits are discounted.
Generally, the market rate is used for this purpose but it fails to solve the purpose where there is multiplicity of rate of interest in the market or the private and social rate of discount may not concede, hence there is no scientific way of choosing a suitable rate.
Pigour and Dobb regard the use of social time preference rate as ‘pure myopia’. They allege that people are victims of “defective telescopic facility” that is why they prefer consumption to future consumption. But they reject this view on the ground that society is a continuous entity and it has collective responsibility for future generations.
So they favour zero social time preference rate because the present and future should have equal weights in the estimation of the society. According to Marglin, this view is an “authoritarian rejection of individual preferences”. Sen and Eckstein pointed out that the rational fear of death is sufficient for people to have positive social time preference rate.
Hirschleifer and other use the concept of social opportunity cost to measure the social discount rate. “The social opportunity cost is a measure of the value of society of the next best alternative use to which funds employed in public project might otherwise have been put.”
The next best alternative use of funds is investment in private sector. If they earn a rate of 6 per cent, the public investment must also earn a rate of 6 per cent or more. Thus, social rate of discount is 6 per cent. If the public project earns 6 per cent, it should not be undertaken.
Thus, the social opportunity cost method of calculating the social discount rate is not free from certain shortcomings. Hence, it is difficult to find a rate of return which may measure the social opportunity cost of funds. According to Feldstein, the social opportunity cost depends on the sources of particular funds, it must reflect social time preference function.
He, therefore, suggests a method of combining the two. The procedure is to allow for the social opportunity cost of funds directly by placing a shadow price on the funds used in the project and to make all inter-temporal comparisons with social time performance rate.
On the other hand, Mishan suggested that if the government has the power to invest in private sector, then the social opportunity cost rate can be used social rate of discount.
Marglin have argued for a synthetic discount rate. They pre-assumed that the social time preference rate is less than social opportunity cost rate. Therefore, there will be under investment in the economy which requires a synthetic discount rate for public investment. The synthetic discount rate is some weighted average of the social time preference rate and the social opportunity cost rate.
Baumol does not agree with Marglin that there should be synthesis of the two rates. He regards the choice of rates as indeterminate because of the existence of risk and institutional barriers which will prevent the two rates to be in equilibrium.
Pearce suggested that the correct answer to the choice of social discount rate does not lie in the selection of single rate, but in the use of both the social time preference and the social opportunity cost rates according to the type of benefits yielded and the type of forgone expenditure.
He concluded that it would not matter which rate is chosen. If equilibrium conditions prevail, the necessity for the estimation of a synthetic discount rate disappears.
8. Uses of Cost Benefits Analysis:
The uses of cost benefit analysis can be made on the following ground:
(a) Evaluation on the Basis of Benefit:
Benefits refer to the addition to the flow of national output resulting from investment in particular project. Those projects are said to be profitable whose contribution to national output is greater than those with a smaller contribution. Benefits may be real or nominal and direct or indirect.
(i) Real Benefits:
In cost benefit analysis, we are concerned with real benefits rather than nominal benefits flowing from a project. A river valley project may increase irrigational facilities to the cultivators but if at the same time, the state levies heavy betterment levy on them, the benefit is nominal.
But if the same project besides increasing irrigational facilities raises productivity of land per acre and leads to a number of other external economies whereby real income of the farmer rises, then, it is said to lead to real benefits.
(ii) Direct and Indirect Benefits:
Direct benefits are those which can be obtained immediately and directly from the project and indirect benefits are those which are more or less identical to direct benefits. The direct benefits flowing from multipurpose project are flood control, irrigation, navigation, development of fisheries etc.
But there may be also certain side effects of the project which may be categorised as indirect benefits. For example, the construction of the Bhakra Nangal Project in Punjab has provided employment opportunities to thousands of people. It led to the construction of new railway line connecting Nangal Township and the Bhakra Nangal Dam with the rest of the country.
New roads have been laid. The Bhakra Nangal Dam has been developed into a tourist resort thereby augmenting income. The direct and in direct benefits must be taken into consideration while evaluating the project.
According to Prof. Bruton, “Project evaluation should take into account the effects of a project on the rate of investment, on the growth rate of population, on the acquisition of skills and managerial talents by the people.”
(iii) Tangible and Intangible Benefits:
Benefits flowing from a project may be tangible or intangible. Tangible benefits are those which can be computed and measured in terms of money while intangible benefits cannot be measured in monetary terms. For example, benefits flowing from the Bhakra Nangal Project are tangible and can be computed.
Intangible benefits enter into individual valuations, for which there is neither a market nor a price. They may be positive or negative.
(b) Evaluation on the Basis of Costs:
The calculation of cost of a project is very difficult because various types of costs are considered in its construction. Costs mean the value of resources used in the construction of a project.
(i) Real and Nominal Costs:
Costs may be real or nominal as they involve real sacrifice on the part of people or otherwise not. If money is borrowed from the people, it is a case of nominal cost. But if people are required to construct project themselves, they will be incurring real sacrifice and then it will be case of real cost.
(ii) Primary and Secondary Costs:
Primary or direct costs are those which are directly incurred on the construction of a project but the secondary costs include the cost providing benefits to the people working on project such as cost of constructing houses, schools, hospitals etc. at the sight of project.
(iii) Associated Costs:
They are the value of goods and services needed beyond these included in the cost of a project to make immediate products or services of the project available for use or sale. For example, the farmer’s cost of producing irrigated crops other than any charge for water would be his associated costs of producing crops.
(iv) Project Costs:
These are the value of resources used in constructing maintaining and operating the project. This includes cost of labour, capital, equipment, intermediate goods, natural resources and foreign exchange etc.
9. Limitations of Cost Benefit Analysis:
Cost benefit analysis is a powerful technique regarding the selection and rejection of project even then it is not free from drawbacks.
Some of its limitations are as under:
1. Difficulties in Benefit Assessment:
The correct estimation of benefits from a project also becomes difficult due to uncertainty regarding the future demand and supply of the products from a new project and their prices. Another difficulty arises from the existence of external economies.
The presence of external economies may lead to the selling of the product of project at price equal to marginal cost and not equal to average cost which will create a deficit and efforts are made by a special levy on consumers or through budgetary resources.
According to Prof. Lewis, “To calculate the true net social benefit of an investment calls for skepticism as well as skill. The figures submitted to government almost always involve exaggerated optimism and double counting. If one uses low shadow wage in valuing labour, when calculating costs, one must not give extra a credit to the project also when calculating benefits because it will relieve unemployment. Shadow prices may be applied to costs or to benefits, the same item should not appear in both. Again annual values and capital values should not be added together.”
2. Arbitrary Discount Rate:
The social rate of discount assumed for any project is arbitrary. There is no perfect method to find social discount rate. It remains a subjective phenomenon. But if there is a small change in social discount rate it may change the full results of project evaluation. The arbitrarily large discount rate does not help in calculating the net present value of benefits of long term projects.
3. Ignores Opportunity Cost:
It also ignores the problem of opportunity cost. Griffin and Enos state that if all prices reflect opportunity costs, all projects for which B/CI would be chosen.
4. Problem of Externalities:
The side effects of a project are difficult to calculate in this analysis. There may be technological and pecuniary externalities of a river valley project, such as the effects of flood control measures or a storage dam on the productivity of land at other places in the vicinity.
5. Difficulties in Selecting Appropriate Decision Rules:
There are three decision rules for the evaluation of project. These are NPV criterion, IRR criterion and SRD criterion. All these criterion have their own advantages and disadvantages. Therefore, it becomes difficult to decide as to which criterion should be used for the evaluation of the project because the wrong selection will lead to false conclusions.
6. Difficulties in the Cost Assessment:
Cost estimates are made on the basis of the choice of techniques, locations and prices of factor services used. Market prices of factors of production are used for this purpose provided they reflect opportunity cost.
But in underdeveloped countries, market prices usually do not reflect the opportunity costs, because there is fundamental disequilibria which is reflected in the existence of massive under-employment at the prevailing level of wages, the deficiency of funds at prevailing interest rates and the shortage of exchange at current rates of exchange.
The equilibrium level of wage rates will be considerably lower than market wages while equilibrium interest rates will probably be much higher than market rates. To remove this difficulty, the use of ‘shadow prices’ or ‘accounting prices’ have been suggested by J. Tinbergen, H.B. Chenery and K.S. Kretchmer.
These shadow prices reflect the intrinsic value of factors of production. In the cost benefit analysis, we cannot take the opportunity cost of labour as zero.
7. Neglects Joint Benefits and Costs:
It ignores the problems of joint benefits and costs arising from a project. There are number of direct and indirect benefits flowing from river valley project but is difficult to evaluate and calculate such benefits separately. Similarly, the joint costs that cannot be separated are calculated benefit-wise.
8. Adjustment for Risk and Uncertainty:
It is done in three ways, at the time of calculating the length of project life, the discount rate and by making due allowance in benefits and costs. It is advantageous to use the Government borrowing rate. The Research Programme Committee of the Indian Planning Commission suggests 5 per cent as productivity rate and 10 per cent as capital scarcity rate.
