This article provides an overview on the price elasticity of supply.
Meaning of Price Elasticity of Supply:
Like price elasticity of demand, price elasticity of supply is a measure of responsiveness — a measure of the market sensitivity of supply.
Price elasticity of supply can be defined as the degree of responsiveness of the quantity supplied of a commodity to a change in its market price holding all other things constant. To be more precise, price elasticity of supply measures the percentage change in quantity supplied of commodity in response to a small percentage (say 1%) change in its own price.
The coefficient of price elasticity of supply of some good, say X is expressed as:
ADVERTISEMENTS:
Es = (% change in the quantity supplied of good X) / (% change in price of good X)
This may also be expressed as:
Es = ΔQ/Q/Δ P/P
While the coefficient of price elasticity of demand is always negative, Es is always positive since the supply curve usually slopes upwards from left to right.
ADVERTISEMENTS:
Suppose, a 12% decrease in quantity supplied following an 8% decrease in price results in an elasticity coefficient of 12%/8%=1.5, indicating that supply is price elastic, or that sellers are responding strongly to the price change. A 6% increase in quantity supplied following an 18% increase in price means supply is inelastic, or that sellers are responding weakly, as shown by the elasticity coefficient of 6%/18% = 0.33.
Determining Percentage Changes:
Often the percentage changes in price and quantity needed to calculate elasticity are not given and simple price and quantity numbers must be converted to percentage. These percentage changes are determined by dividing the change in quantity by the original, or base, quantity and the change in price by the original, or base, price, or
As in the case of demand, we are interested in the size, and not the direction, of the change.
ADVERTISEMENTS:
Suppose a seller supplies 300 units of a product at a price of Rs. 50 each, and 390 units when the price rises to Rs. 75,
as shown in the following supply schedule:
The percentage change in quantity supplied is equal to the change in quantity of 90 units divided by the original quantity of 300 units, or 90/300 = 30%. The percentage change in price equals the change in price of Rs. 25 divided by the original price of Rs. 50, or Rs. 25/Rs. 50 = 50%. From this, elasticity can be calculated in the usual way by dividing the percentage change in quantity supplied by the percentage change in price 30%/50% = 0.6.
The following equation summarises these calculations:
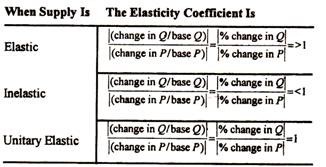
Finally, a given percentage change in price could result in an equal percentage change in quantity supplied. For example, a 4% change in price could lead to a 4% change in quantity demanded or supplied. When this occurs, the elasticity coefficient is equal to one, and demand or supply is unitary price elastic. Table 8.4 summarises the measurement of elasticity using elasticity coefficient.
Table 8.4: The measurement of elasticity:
When the absolute value of the percentage change in quantity is greater than, less than, or equal to the absolute value of the percentage change in price, supply is elastic, inelastic, or unitary elastic, respectively.
A study of price elasticity of demand reveals that it is dangerous to infer elasticity from the slope of the curve. But it is very easy to calculate price elasticity of supply from the slope of the supply curve. Three important points may be noted in this context.
Three Points:
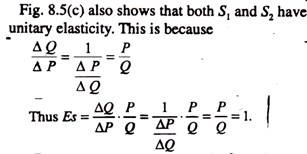
The first point is that any straight line supply curve that intersects the vertical axis will be elastic and its value will lie between one and infinity. The second point is that a straight line supply curve that intersects the horizontal axis will be inelastic and its value will lie between zero and one. The third point is that any straight line supply curve through the origin will have unitary elasticity.
These three points are illustrated in Fig. 8.5:
ADVERTISEMENTS:
This is so because at any point on the supply curve P, Q and ΔP, ΔQ form similar triangles with the supply curve.
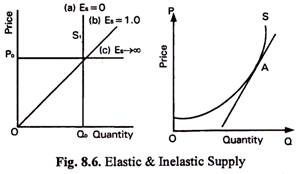
It is possible to judge the category of price elasticity of supply at any point on a supply curve by drawing a tangent to the point of the curve we wish to know about. If the tangent intersects the vertical axis then supply is elastic at that point. If it intersects the horizontal axis, as in Fig. 8.5, then it is inelastic.
Two Extreme Situations:
Fig. 8.6 shows two extreme situations of perfectly elastic and perfectly inelastic supply. The vertical supply curve shows perfectly inelastic supply. This is the case where the quantity offered for sale is fixed, as in the case of perishable goods like fish or vegetables. These are brought to a market in the morning and are sold at whatever price they fetch. This is polar (limiting) case of perfectly inelastic supply.
ADVERTISEMENTS:
The horizontal supply curve shows another extreme case, i.e., that of perfectly inelastic supply. The implication of such a supply curve is that a little price will cause the quantity supplied to fall to zero while a slightest increase in price cut will induce purchasers to offer an indefinitely large quantity. In this polar case of an infinitely elastic supply the ratio of the percentage change in quantity supplied to percentage change in price is extremely large and yields a horizontal supply curve.
Between the two polar cases, supply may be elastic or inelastic depending upon whether the percentage in quantity is larger or smaller than the percentage increase in price. Fig. 8.6 also shows an intermediate case of straight line, starting from the origin, showing the border line case of unit elasticity, where the percentage increase in quantity supplied is exactly equal to the percentage increase in price.
So like price elasticity of demand there are five cases of elasticity of supply. In Fig. 8.7, we illustrate two limiting cases of supply elasticity. If supply is completely inelastic, the supply curve will be a vertical straight line (labelled eS = 0) as shown in Fig. 8.7. The supply curve has zero elasticity because the same quantity (q0) is offered for sale at all possible prices.
An exactly opposite type of supply curve is the one labelled Es → ∞. This supply curve is horizontal. It has infinite elasticity. This means that suppliers would be ready to offer an unlimited quantity for sale at the price p0 — but a slight fall in price would reduce the quantity supplied to zero. Such a curve is often described as being perfectly (or completely) elastic.
ADVERTISEMENTS:
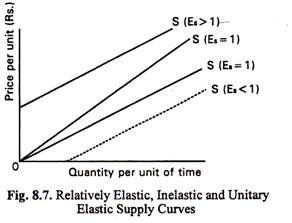
In Fig. 8.7 we show four supply curves. The two labelled Es = 1 have unit elasticity. In fact, in all straight line supply curves passing through the origin have unit elasticity. They may be called unitary elastic supply curves.
The reason is simple the proportionate change in price and quantity are the same at all points on such curves.
For any straight line supply curve intersecting the price axis, Es > 1. Thus in Fig. 8.7, the curve labelled Es > 1 is relatively elastic. In contrast, for any supply curve intersecting the quantity axis, Es < 1. Thus in Fig. 8.7, the curve labelled Es < 1 is relatively inelastic.


