
This article provides an overview on the Human Development Index (HDI).
Subject Matter:
When countries’ per capita GDP ranking rise from one year to the next, governments find satisfaction and they boast over the achievements.
But per capita GDP ranking hides a lot of things, a new indicator has been evolved to understand the dynamics in achievements in the quality of. This index, popularly called—Human Development Index—was first launched in the 1990 Human Development Report.
This index provides an assessment of a nation’s achievement and helps ranking of different countries. The HDI is calculated to emphasise that people and their capabilities should be the ultimate criteria for assessing the development of a country, not growth alone. It is a single statistic that serves as a benchmark for both social and economic development.
ADVERTISEMENTS:
Since 1990, a family of human development indices has been constructed over the years. The most important among them introduced in 1995 ire ‘Gender-related Development Index (GDI) and ‘Gender Empowerment Measure’ (GEM). In addition, ‘Gender Equality Index’ (GEI), ‘Human Poverty Index’ (HPI), etc., have been introduced. In 2010, the UNDP devised a new index, called Multi-dimensional Poverty Index’ (MPI) that captures various dimensions of human poverty.
Calculating the Human Development Index (HDI) :
In 1990, the UNDP introduced HDI as a policy tool for comparing development achievements between countries and between groups/ states/regions within countries over time. The HDI ranks all countries on a scale of 0 (lowest human development) to 1 (highest human development). Such ranking is based on three basic dimensions/indicators of human development. These are: a long and healthy life, access to knowledge, and a decent standard of living.
Longevity—a long and healthy life—is measured by life expectancy at birth. Access to knowledge is measured by combination of mean years of schooling and the expected years of schooling. Thirdly, a decent standard of living is measured by ‘real’ GNP per capita at purchasing power parity, PPP, in US dollars. It is, thus, evident from these indicators that the HDI is a multi-dimensional concept that takes into account not only health and education but also per capita income.
To construct HDI, an index—fixed minimum and maximum values—is created for each of the three indicators. To calculate these dimension indices, the maximum and minimum values, called goalposts, are chosen for each of the three dimensions.

Now for any component of HDI, performance in each indicator is computed according to the following general formula:
Dimension index = actual value – minimum value/maximum value – minimum value
Each index is expressed as a value between 0 and 1. If the actual value of an index coincides with the minimum value, the index becomes zero, or if the actual value of an index becomes equal with the maximum value, the index becomes one.
Calculating the Life Expectancy Index (L):
The life’ expectancy index measures the relative achievement of a country in life expectancy at birth. For instance, India’s life expectancy at birth as per 2011 census is 75.2 years. Now the life expectancy index is 0.870.
ADVERTISEMENTS:
Life expectancy index:
(L) = 65 .3-25/ 85-25 75. 2-20/ 83.4-20 = 0.870
Calculating the Education Index (E):
The education index is composed of two parts: mean years of schooling index and expected years of schooling index. This index, thus, measures a country’s achievements in these two sub-indices. First, we calculate an index for mean years of schooling index and then another one—expected years of schooling index. Then these two indices are combined so as to calculate education index.
To calculate education index (E), let us apply the dimension index of each of the two sub- indices: mean years of schooling index and expected years of schooling index. Then geometric mean of these two sub-indices using 0 as the minimum value and the highest geometric mean (GM) of the resulting indices as the maximum. In other words, E is the geometric mean of the two indices.
For India, let us assume the maximum mean years of schooling is 5.5 years while the observed maximum mean years of schooling is 13.1 years in 2011. Thus, the mean years of schooling index
= 5.5-0/13.1-0 = 0.478
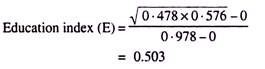
The maximum expected years of schooling in India is 10.4 years and the observed maximum expected years of schooling is 18 years. Thus the expected years of schooling index
10. 4-0/18-0 = 0.576
Combining these two sub-components, one obtains the education index
Calculating the real GNP index (PC):
The construction of real GNP index is somewhat complex. It may be noted that the above two indices—life expectancy index and education index—are primarily dependent on the income level, although such income level does not get reflected straight forward in these two indices. Accordingly, income is adjusted simply by taking the logarithm of current income.
To enable cross-country comparisons, per capita income is adjusted for PPP reflecting the relative purchasing power of the currency. Indeed, this is expressed in US dollars.
If India’s per capita real GDP in 2010 is $ 2,248, internationally adjusted real GNP per capita becomes:
Income index (PC)
ADVERTISEMENTS:
= In (2.805)-In (100)/In (l, 07,721)-In (100) = 0.478
This says that the natural logarithm of the actual and maximum values is used to get income index (PC).
Calculating the HDI:
Now we are in a position to calculate HDI as a geometric mean of the three dimension indices:
![]()
ADVERTISEMENTS:
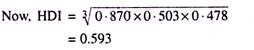
Thus the HDI reflects the average achievements of a country along the above three dimensions. Its value lies between 0 (zero) (the lowest level of human development) and 1 (the highest level of human development) and countries are then ranked according to the HDI. In the Human Development Reports published annually by the UNDP countries with an HDI value of 0.800 and above are considered ‘high human development countries, and those below 0.500 are considered ‘low’ human development countries.
It may be added here that there is a close relationship between economic growth and HDI. More economic growth enables a country to have more resources so as to permit ‘sustained improvements in human developments’. On the other hand, improvement in the quality of human capital triggers growth further.
Changes in HDI Methodology:
How the HDI is constructed can be simplified with the aid of the diagram on the next page:
New Definitions:
(a) Mean years of schooling:
ADVERTISEMENTS:
Average number of years of education received by people aged 25 and older, converted from education attainment levels using official durations of each level.
(b) Expected years of schooling:
Number of years of schooling that a child of school entrance age can expect to receive if prevailing patterns of age-specific enrolments persist throughout child’s life.
Gross NI per capita:
Aggregate income of an economy is generated by its production and ownership of factors of production, the incomes paid for the use of factors of production owned by the rest of the world, converted to international dollars using PPP rates, divided by the mid-year population.

The HDI methodology was revised in 2010. HDI is a composite index in 3 basic dimensions— health, knowledge, and income. From 2010 HDI, health is still measured by life expectancy at birth. However, the 2010 HDI measures achievement in knowledge by combining the expected years of schooling for school-age children entering school today with the mean years of prior schooling for adults aged 25 and older. Further, the income measurement has been changed from PPP-adjusted per capita GDP to PPP-adjusted per capita GNI that includes remittances.
ADVERTISEMENTS:
These changes are of importance for many reasons. First, adult literacy rate used in the old HDI (which is simply a binary variable—literate or illiterate, with no gradations) is inadequate in measuring the attainment of knowledge. By including average years of schooling and expected years of schooling one can better capture the level of education. Secondly, GDP is the monetary measure of goods and services produced in a country, irrespective of how much is retained in the country.
On the other hand, GNI measures the income accrued to residents of a country, including some international flows, and excluding income generated in the country and repatriated abroad. Thus, GNI is a more accurate measure of a country’s economic welfare. Thirdly, prior to 2010, the HDI report used the arithmetic mean (AM) from 2010, it uses geometric mean (GM) of dimension indices.
Classification of Countries According to Human Development Index:
Countries are grouped and ranked by their HDI value. The UNDP earlier classified countries in three groups: high, medium, and low HDI. The UNDP, in its 2010 Report, classified it into four groups: very high, high, medium, and low. In this Report as many as 187 countries have been considered. The very high, high, and medium HDI groups have 47 countries each, and the low HDI group has 46 countries.
The number of very high human development countries now (2012) stands at 47 out of 187 countries. 47 countries fall in the category of high human development. Again, 47 countries have been placed in the state of medium human development and that of low human development falls in the range of < 0.500. In this category, there are as many as 46 countries, as per the Human Development Report, 2012. This splitting of very high and high HDI value classification, however, was made in 2009 Human Development Report.

Classification of Indian States according to HDI:
We can also present HDI value for the Indian states, as per 2011 State Human Development Report. According to this report, Kerala stands first in HDI among the states of India. However, Chandigarh stands first in HDI among the Union Territories of India (Table 1.3).

The Indian Planning Commission has been constructing the HDI for the Indian states. Such was made first in 2001. The methodology used for the construction of HDI is similar to that of the UNDP in terms of the ‘dimensions’ used. However, in terms of process ‘indicators’, the ‘ methodology is slightly different from that of the UNDPs.
In recent years, many states have also prepared state-level HDRs in which district-level HDI is imputed. Despite limitations of HDI—both at the all-India level and the state-level—it is used a useful tool for policy analysis. The HDI data enables one to evaluate inter-country, intra-country among the different regions or states, and inter- district disparities within a state. This, then, spurs competition among different countries, states, and districts to improve their HDI rankings.
Limitations of HDI:
As soon as human development was brought into the domain of development economics, attention was shifted from GNP. It then broadened the concept of human measure of development.
Since 1990-91 we have seen the most extensive use of HDI to understand the state of differences across countries in their levels of development. As is clear from the above discussion, the HDI is simple to compute. In view of this, its appeal as a measure of well-being or the quality of life—rather than only per capita income—is rather strong and universal. But that does not mean that this index is fault-free. Because of certain limitations of HDI, several attempts have been made to remove some inaccuracies. Even then, inaccuracies in the index persist.
Most important among them are noted:
A Mixture of Stock and Flow Variables:
ADVERTISEMENTS:
The HDI takes both stock variables (e.g., adult literacy index, life expectancy at birth index) and flow variables (real per capita GDP, gross enrolment rates, etc.,) into account to construct the HDI value. It is because of mixing of these two types of variables that one sees erratic movements in HDI.
For instance, India’s ranking across countries was 119th in 2010 Human Development Report. Despite an improvement in HDI value in 2010, India slipped to 134th. And for China, the ranking fell from 89th in 2010 to 101 in 2011. Again, comparison of GDP and HDI ranking becomes complicated since the former is a flow variable while the latter is the combination of both stock and flow variables.
Neglect of Distributional Issue:
The HDI is criticised for its neglect on issues of distribution relating to gender, religion, ethnicity, income, caste, occupation, etc. In other words, the HDI is ‘a summary measure of average human development’, but ignores distributional aspects of human development.
However, to overcome this problem, some supplementary indices such as Gender-related Development Index (GDI), Gender-equality Index (GEI), Human Poverty Index (HPI), Multidimensional Poverty Index (MPI), etc., have been introduced to measure empowerment and deprivations. Further, in India, state-wise HDI ranking is being carried out so as to measure developmental gaps and benefits accruing to each state/union territory.
New Dimensions Need Inclusion:
Besides these conceptual limitations, the HDI has a limited use. Indeed, it is true that the concept of human development is a broader one than the traditional concept of development. But it is silent on many integral parts of human development, like political freedom, civil and political rights, environmental quality, food and nutrition security, job security, health security, energy security, crime and violence, etc.
It is known to all that despite high GDP and high HDI values, countries like the United States, Canada are troubled heavily by social divisions and conflicts, as also rising criminal activities. These surely lower the level of ‘real happiness’. Further, illegal drug businesses result in a variety of social problems in these countries: rape of women, rising number of jail-birds, killing of human beings and suicides, divorce, pre-marriage birth, etc. Had these issues been incorporated in HDI, these countries could have been ranked at lower level. Of course, these dimensions are of great importance to measure a good quality of life.
Problems Associated with the Choice of Indicators:
Based on three indicators—educational attainment index measured by adult literacy and gross enrolment ratios, longevity index, and income per head—HDI is constructed. Critics argue that it is difficult to define literacy, particularly due to language differences. It is difficult to grasp Spanish and Chinese languages. It is also said that the literacy measure speaks very little about the quality of literacy.
A man, however, is said to be literate if he can read and sign his name. Human Development Report considers this definition of literacy. An example will suffice our purpose: Despite an adult literacy rate of 99 p.c. in Canada, it had been found in 2000 that 20 p.c. of Canadians were not functionally literate as they could not read and understand a simple set of instructions.’ In other words, literacy index as used is not thought to be an ideal one. This functional literacy can also be called lasting literacy.
Questionable Data Quality:
Data quality is subject to serious scrutiny. Most of the data— particularly on adult literacy and life expectancy— are not updated regularly. Often, old data are used to construct HDI. Possibly, because of these limitations, literacy index has been replaced by access to knowledge in 2010.
Conclusion:
In spite of these limitations, the concept of HDI as a summary measure of human development serves as a better guide to the policymakers. Some of the above limitations have already been addressed. HDI remains a very widely used tool today than the normally income-based indicator—GNP. The success of the HDI is remarkable.
Summary of HDI Reforms:
It may be noted that the HDI construction method used since the early 1990s revealed some deficiencies. To overcome such, the HDI construction method has been marginally changed by assigning new maximum and minimum values of each three indicators.
The two indicators of ‘knowledge’ dimension—the adult literacy rate and the combined gross enrolment ratio—of the earlier HDI reports has been modified in 2010 HDR by taking into account expected years of schooling and mean years of schooling. Further, instead of GDP per capita (PPP US $) indicator to assess the standard of living, the 2010 HDR considers GNI (gross national income) per capita.
Let us have a look at the HDI construction methods used before 2010 and 2010 onwards in the following form (Table 1.4):
