Following are the characteristics of duopoly:
i. Two producers or sellers of a product
ii. Perfectly identical or almost identical products
iii. Independent price policy followed by both the sellers or they may agree upon a uniform price
ADVERTISEMENTS:
iv. Both the sellers may compete with each other or agree to co-operate with each other
“Duopoly is that situation of a market in which there are two producers of a product, either perfectly identical or almost identical. They are not bound by the agreement regarding price or quantity of production.” Dr. John.
Duopoly can be of two types, which are explained as follows:
i. Duopoly without product differentiation:
Refers to a type of duopoly when organizations sell identical products. In such a situation, an agreement may be formed between organizations to set a fixed price or divide the markets. In case, if there is no agreement, the price war may take place among organizations.
ADVERTISEMENTS:
The one with the lower price would gain the market share and a simple monopoly would be established. Organizations will be able to maximize the profits in case they collude together by charging same prices.
ii. Duopoly with product differentiation:
Refers to a duopoly when the organizations sell differentiated products. There is no fear of rivals and there will be no agreement between the organizations. The organization with better products will gain supernormal profits.
There are three types of duopoly models pertaining to price-output decisions under duopoly market situation;
ADVERTISEMENTS:
These three models are shown in Figure-5:
1. Cournot’s Duopoly Model:
Cournot duopoly model was propounded by a French economist, Augustin Cournot in 1838 for price-output determination under duopoly. Cournot model is based on the market condition in which there are only two sellers, that is duopoly. However, the model is also applicable to oligopolistic market conditions. Let us explain the model with the help of an example taken by Cournot. Suppose there are two producers, each operating two identical springs of mineral water, being produced at zero cost.
Following assumptions are taken in this model:
i. Both the producers operate at zero cost of producing water
ii. Both the producers face the same demand curve with negative slope
iii. Both the producers assumes that competitors will not react to the change in price or output
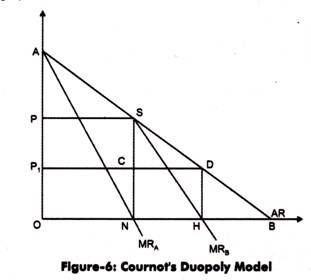
Figure-6 shows the Cournot’s duopoly model:
In the Figure-6, the demand curve (AR curve) faced by two organizations for mineral water is given by a straight line AB. The total output produced is equal to OB where maximum daily output of each mineral spring is ON = NB. Assume that producer A starts the business first. It implies that he/she is the monopolist and produces ON level of the output, which is the maximum level of output.
Since costs are zero, the profit will be equal to ONPS. The price charged is equal to OP. Now, suppose that the producer B enters into business and notices that producer A is producing ON amount of output. The market which is unsupplied by A is the market open for B equal to NB. B will produce output assuming that A will not change its price and output (as he is making maximum profits).
The demand curve faced by producer B is equal to SB and thus, MRB can be drawn equal to SH. At this point, price falls to OP1 and thus output produced is equal to NH (one-fourth of the market = ½ of NB=½ of ½=¼). The total profits of producer B are equal of NHCD.
From Figure-6, it can be seen that with the entry of producer B, price has fallen to P1, which has decreased the profits of A to ONCP1. Thus, A would make adjustments in price and output assuming that B would not change his output and price levels. He/she would produce ½ of the (OB-NH) of the market.
ADVERTISEMENTS:
OB-NH =1-¼= ¾
Thus, output produced by A is= ½(3/4) = 3/8.
Now, B will notice that his/her total profits are less than that of A. Thus, he/she will produce ½ of (OB- new output of A)
= ½(1-3/8) = 1/2 5/8= 5/16 of the market
ADVERTISEMENTS:
This process of adjustments will continue until both of their market shares are equal to one third. Till that, B would continue to gain and A would continue to lose. This model concludes that under Cournot’s duopoly situation, each seller ultimately supplies one- third of the market. Both the producers charge the same price and one-third of the market remains unsupplied.
Cournot’s model attains the stable equilibrium; however it is criticized on the following grounds:
i. Assumes that each producer would be producing the same level of output. However, this assumption is wrong as output of the rivals does not remain fixed.
ii. Assumes that the cost of production remains nil, which is not true in every kind business.
2. Edge-worth Model:
ADVERTISEMENTS:
As discussed, in Cournot model, the output of rival organization is assumed to be constant and unchanged. In the Edge-worth model, the price of the rival organization is assumed to be unchanged.
The assumptions of this model are as follows:
i. Each organization believes that its rival organization will not change its price
ii. Neither of the organizations can produce an output as large as the competitive output
iii. The maximum possible output is the same for both the organizations
iv. The product is homogenous, which implies there are no brand and quality variations
ADVERTISEMENTS:
v. Consumers prefer to buy at the lowest price possible
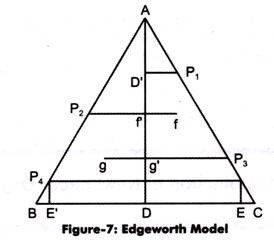
The Edge-worth model is explained with the help of Figure-7:
In Figure-7 AC is the organization A’s demand curve, whereas AB is the organization’s B’s demand curve. The maximum output that can be produced by A and B is DE and DE’, respectively. Suppose organization A is the first to enter the market and sets the price P1 where output is D’P1. Now, organization B enters the market and sets price lower than A that is P2.
In such a case, organization B captures the market share of A which is equal to ff’. Now, A reacts and lowers its price to P3 and captures B’s market share equal to gg’. This process will continue until price equals P4 and output produced by both A and B equals maximum output.
At P4, no one can snatch the market share of each other. Now, A again raises the price to P1 considering that B has fixed its entire supply at P4. B again follows A and thus process continues between P1 and P4.
ADVERTISEMENTS:
3. Chamberlin Model:
Chamberlin model is based on an assumption that both the organizations existing in the market are mutually interdependent on each other.
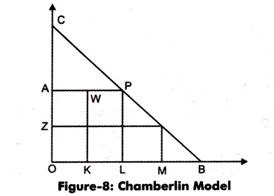
Let us understand Chamberlin model with the help of Figure-8:
Suppose there are two organizations A and B in the market. Organization A enters the market first. In Figure-8, BC is the demand curve and OL is the total output produced by A which is sold at price OA. The total profit is OLPA. Now, producer B enters the market and produce LM level of output. Thus, the total quantity produced is equal to OL + LM – OM.


