
Compilation of Notes on the Central Problems of an Economy with its solution for class 10, 11 and 12 students.
Rich or poor, developed or undeveloped, every economy must face three central problems.
These are:
(A) What to produce?
ADVERTISEMENTS:
(B) How to produce? and
(C) For whom to produce?
Following is a brief description of these problems:
(A) What to Produce?
This problem has two dimensions:
ADVERTISEMENTS:
(i) What goods are to be produced, and
(ii) In what quantity goods are to be produced.
(i) What Goods are to be Produced?
Broadly, goods are classified as –
ADVERTISEMENTS:
(a) Capital goods, and
(b) Consumer goods.
Production of both capital and consumer goods is essential for the economy. Capital goods (like plant and machinery) are needed for further production and future growth. Consumer goods are needed for present consumption.
If the limited resources are largely used for the production of consumer goods, the present generation will enjoy good quality of life. But, lack of capital goods would mean lack of future growth. The future generations would suffer.
Likewise, if the limited resources are largely used for the production of capital goods, the future growth would be high. But, the lack of consumer goods would mean that the present generation will have low standard of living. Hence, the problem called the ‘problem of choice’ or the ‘problem of allocation of limited resources’ to different uses.
Production of consumer goods is essential to raise standard of living of the present generations. Production of capital goods is essential for future growth.
(ii) In What Quantity Goods are to be Produced:
Once, we understand that the production of both consumer goods and capital goods is essential, another question arises. How much of consumer goods and how much of capital goods? Because, (owing to limited resources) more of consumer goods would mean less of capital goods and more of capital goods would mean less of consumer goods.
Here, it is important to understand that the loss of quantity of consumer goods is the cost of producing more of capital goods. Likewise, loss of quantity of capital goods is the cost of producing more of consumer goods. In economics, this is called opportunity cost. While shifting resources from one use to the other, we must find out the opportunity cost of doing it.
(B) How to Produce?
ADVERTISEMENTS:
‘How to produce’ refers to the technique of production.
Broadly, there are two techniques of production –
(i) Labour-intensive technique, and
(ii) Capital-intensive technique.
ADVERTISEMENTS:
Labour-intensive technique implies greater use of labour than capital, while capital-intensive technique implies greater use of capital (machines, etc.) than labour. Capital-intensive technique promotes efficiency.
It accelerates the pace of growth. On the other hand, labour-intensive technique promotes employment. The choice between the labour-intensive and capital-intensive techniques becomes a problem because labour-intensive technique helps reduce unemployment, while capital- intensive technique accelerates GDP growth.
Here again, the root cause of the problem is ‘scarcity of resources’. In countries like India, capital is so scarce that fuller utilisation of labour is not possible (Note- Employment of labour needs capital). In rich countries, labour is so scarce that fuller utilisation of capital becomes a problem.
(C) For Whom to Produce?
Owing to limited resources, an economy cannot produce goods for all sections of the society to the extent desired.
ADVERTISEMENTS:
Broadly, every economy has two sections of the society –
(i) The rich, and
(ii) The poor.
Social justice is promoted if more goods are produced for the poor. It would reduce inequality or promote equality. But, there is a hidden cost of doing it.
By producing goods for the poor, the profits of the producers would remain low. Low profits would mean low investment which Implying low GDP growth. The economy would remain backward for a long time to come. Thus, there is a problem of choice: social equality or GDP growth.
Add-on Problems (Specific to Underdeveloped Economies):
ADVERTISEMENTS:
There are two add-on (additional) problems specific to underdeveloped economies like India.
These are:
(i) Problem of underutilization of resources, and
(ii) Problem of growth of resources.
(i) Problem of Underutilization of Resources:
In most underdeveloped economies (like India), the resources are not fully utilised. These are underutilised or inefficiently utilised. Accordingly, actual output remains less than the potential output (maximum possible output attainable with the given resources). Underutilisation of resources occurs due to various reasons. ‘Lack of work culture’ in underdeveloped countries is an important reason for underutilisation of resources. There are frequent strikes and lock-outs which lead to loss of output.
ADVERTISEMENTS:
(ii) Problem of Growth of Resources:
Development of underdeveloped economies is possible only when they discover more resources. But the discovery of resources remains limited owing to the lack of research facilities. Accordingly, underdeveloped economies continue to stagnate at low level of GDP. These economies take much longer time to shift to the higher level of GDP.
Solution of Central Problems in Different Economies:
Different economies solve the central problems differently, as under:
(i) Market Economy:
Market economy is a free economy. It means that producers are free to decide ‘what, how and for whom to produce’. On what basis do they take their decisions? It is on the basis of supply and demand forces in the market.
The decisions are taken as under:
a. What to Produce?
ADVERTISEMENTS:
The producers will produce those goods which offer them high profits.
b. How to Produce?
The producers will always use that technology which maximizes efficiency and minimizes cost.
c. For Whom to Produce?
In a free economy, the producers will produce goods for those people who can afford to pay high price. Poorer sections of the society are often ignored. It causes the problem of Economic Divide (the gulf between the rich and the poor).
Briefly, in a market economy, the decisions relating to ‘what, how and for whom to produce’ are taken with a view to maximizing profits.
(ii) Centrally Planned Economy:
ADVERTISEMENTS:
In a centrally planned economy, decisions relating to ‘what, how and for whom to produce’ are taken by some central authority of the government.
All decisions are taken to maximise social welfare, not to maximise profits. Those goods and services will be produced which the central authority (or the government) finds as most useful for the society. That technique of production will be adopted which is socially most desirable.
In a situation of mass unemployment, for example, labour-intensive technology will be preferred (rather than capital-intensive technology) so that unemployment is reduced. Enough goods will be produced for poorer sections of the society even when production of such goods is not profitable. Social justice is given priority over profit maximization.
Briefly, in a centrally planned economy, the decisions relating to ‘what, how and for whom to produce’ are taken with a view to maximising social welfare.
(iii) Mixed Economy:
Mixed economy shares the merits of market economies as well as centrally planned economies. Decisions regarding ‘what, how and for whom to produce’ are taken both to maximise profits as well as social welfare. In certain areas of production, producers are free to take their decisions with a view to maximising profits.
In certain other areas, decisions are taken entirely on the basis of social considerations. Example- In India, producers are free to produce cloth or steel to maximise their profits. But ‘railways’ are the monopoly of the government. The government provides transport services at nominal rates so that poorer sections of the society can avail them.
Briefly, in a mixed economy, the decisions relating to ‘what, how and for whom to produce’ are neither left entirely to the market forces nor to any central authority. Both ‘market forces’ as well as ‘central authority’ play their role. While market forces tend to maximise profits, the central authority focuses on social welfare.
Production Possibility Curve (PPC) and Central Problems:
To illustrate and analyse the central problems, the economists use the technique of PPC (Production Possibility Curve), also called transformation curve or transformation line.
What is Production Possibility Curve (PPC)?
We shall reach the definition of PPC through an illustration.
We know, resources are limited and have alternative uses. Let us assume that the given resources (along with given technology) are used in the production of apples and wheat.
If all the resources are used for the production of apples, 100 lakh tonnes of apples can be produced. And, if all the resources are used for the production of wheat, 40 lakh tonnes of wheat can be produced. If we decide to produce both apples and wheat, the various possible combinations of the two goods are as shown in Table 1. The table showing different possibilities of production of apples and wheat is called production possibility schedule.

Combination A shows that 100 lakh tonnes of apples can be produced without any production of wheat. Likewise, combination E shows that 40 lakh tonnes of wheat can be produced without any production of apples. Combination B shows that 90 lakh tonnes of apples and 10 lakh tonnes of wheat can be produced with the given resources and technology.
Likewise, combination C shows that 70 lakh tonnes of apples and 20 lakh tonnes of wheat can be produced with the given resources and technology. Combination D shows that 40 lakh tonnes of apples and 30 lakh tonnes of wheat can be produced with the given resources and technology. Representing these various production possibilities on a graph, we get production possibility curve as in Fig. 1.
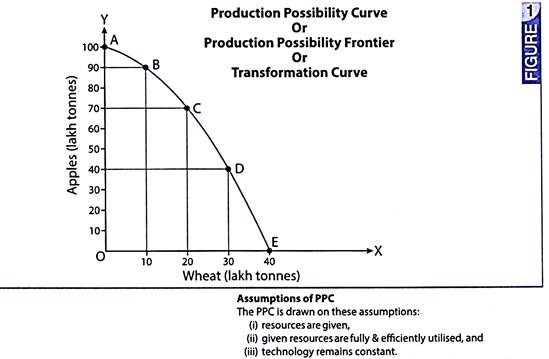
Quantity of wheat is shown on X-axis (horizontal axis) and quantity of apples is shown on Y-axis (vertical axis). Points A, B, C, D and E show different possibilities of production, with the given resources and technology. Joining all these points, we get AE curve. It is the production possibility curve.
We can now define production possibility curve as under:
Production possibility curve is a curve showing different possible combinations of two goods which can be produced with the available resources.
The construction of PPC is based on these assumptions –
(i) Resources are given,
(ii) Given resources are fully & efficiently utilised, and
(iii) Technology (technique of production) remains constant.
Note-
(i) Production possibility curve is a graphic representation of production possibility schedule.
(ii) Production possibility curve is also called Production Possibility Frontier or Transformation Curve.
In what follows, we illustrate the central problems using the concept of PPC:
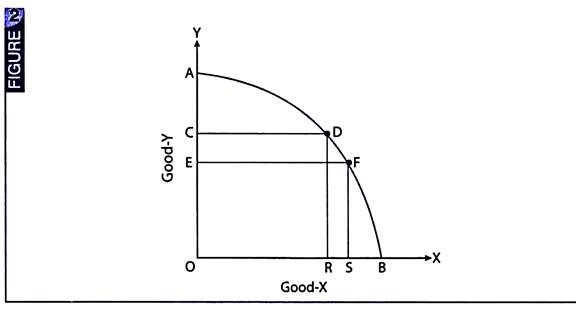
What to produce is essentially the problem of choice – what quantity of Good-X and Good-Y is to be produced? More of Good-X must lead to lesser production of Good-Y. Because, resources are assumed to fully and efficiently utilized, and technology is assumed to be constant. Fig. 2 illustrates this situation. It shows that if production of Good-X is increased from OR to OS, the production of Good-Y must reduce from OC to OE. Because, some resources must be shifted from Y to X.
Some Related Information:
While illustrating the problem of what to produce, PPC offers some useful related information, as under:
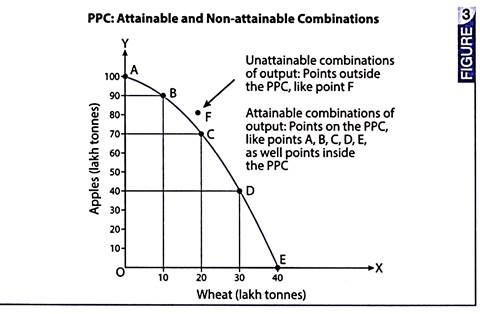
(i) PPC helps identify attainable and non-attainable combinations output. This is illustrated through Fig. 3.
(ii) PPC helps identify potential level of output. It refers to the maximum level of output attainable with the available resources. It is related to fuller and efficient utilisation of resources. Actual level of output may be different from the potential level of output. It refers to that level of output which we actually attain. It is less than the potential level of output if the resources are not fully and efficiently utilised. Thus –
Actual Level of Output ≤ Potential Level of Output (always)
If resources are not fully and efficiently utilized – Actual Level of Output < Potential Level of Output. Fig. 4 illustrates the difference.
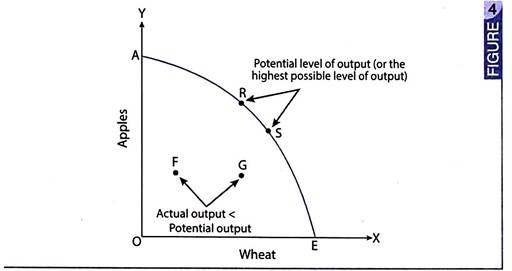
Actual Output = Potential Output, if the economy is operating on the PPC (points R and S, in the Fig. 4).
Actual Level of Output < Potential Level of Output, if the economy is operating inside the PPC (points F and G in the Fig. 4).
(iii) PCC helps identify the opportunity cost of shifting resources from use-1 to use-2. This is indicating by Fig. 5.
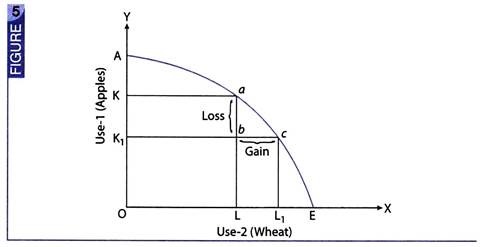
If some resources are shifted from Use-1 to Use-2, the gain of output of wheat = bc, while the loss of output of apples = ab. ab (loss) is the opportunity cost of bc (gain).
The problem of how to produce relates to choice of technique. This problem is particularly serious in underdeveloped economies, facing a difficult choice between conventional technology (labour-intensive but less efficient) and modern technology (capital-intensive and more efficient).
A shift from conventional to modern technology would lead to a shift in PPC, but not without adding to the problem of unemployment. Fig. 6 illustrates this situation.
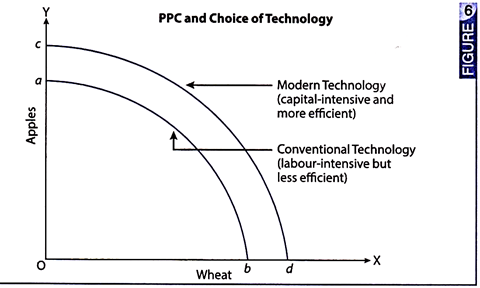
ab in Fig. 6 is related to the use of labour-intensive technology which is relatively less efficient; cd is related to capital-intensive technology which is more efficient. In case we shift from labour-intensive technology to capital- intensive technology, it would be reflected as a shift from ab to cd. However, while the level of output would rise, the problem of unemployment may also rise.
(3) PPC and for Whom to Produce:
For whom to produce is the problem relating to the distribution of income. Skewed (unequal) distribution of income in favour of richer sections of the society would generate more surpluses (savings) for further investment. Accordingly, PPC would shift to the right, but poorer sections of the society would suffer deprivation. Fig. 7 illustrates this point.
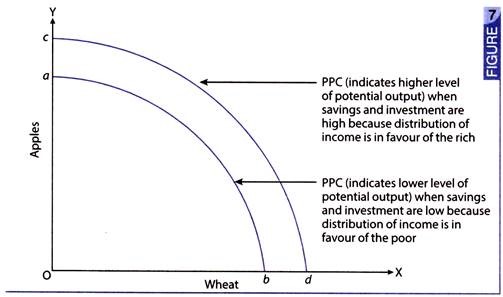
If a country focuses on growth without caring for ‘equality’ (equal distribution of income), it may succeed in shifting from ab to cd. However, economic divide would rise which may lead to social unrest.
(4) PPC and Underutilization of Resources:
In underdeveloped economies, resources are underutilised or are inefficiently utilised. PPC illustrates this situation, as in Fig. 8.
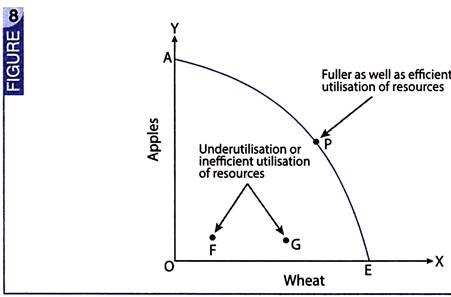
Any point on AE (like point P) corresponds to fuller as well as efficient utilisation of resources. It shows the potential level of output in the economy.
Any point inside AE (like point F or G) corresponds to –
(i) Under-utilisation, or
(ii) Inefficient utilisation of resources.
It shows that the actual level of output is less than the potential level of output.
(5) PPC and Growth of Resources:
Growth/Discovery of resources would lead to growth of potential output. Fig. 9 illustrates this situation.

When new resources are discovered, the economy would shift from ab to cd, implying a higher level of potential output. However, higher level of potential output is achievable only when all resources are fully and efficiently utilised.
Clean India Mission and Growth of Resources:
Clean India Mission impacts the quality of resources. Over time the quality of labour force is likely to improve. Accordingly, PPC would shift to the right. (See Ability Zone for further details.)
Skill India Mission and Growth of Resources:
Growth of resources includes both the quantity of resources as well as the quality of resources. Quantity of resources increases when, for example, mining of minerals is increased. On the other hand, quality of resources improves when, for example – skill-education is spread in the country so that the percentage of skilled workforce (in the total workforce) tends to rise. Production possibility curve tends to shift to the right both when the quantity of resources increases and when the quality of resources increases. ‘Skill India Mission’ by the Government of India is expected to improve the quality of human resources in the country. Accordingly, PPC is expected to shift to the right.
PPC and Opportunity Cost:
What is Opportunity Cost?
Let us begin with an illustration:
Consider one hectare of land being used by you for the production of apples. This is Use-1 of land. Because of some reason, you want to use this land for the production of wheat. This is Use-2 of the same land. Economists call Use-1 and Use-2 as Opportunity-1 and Opportunity-2. Shifting from Opportunity-1 to Opportunity-2 involves some cost: it is the loss of output in Opportunity-1 (= loss of output of apples).
This is called opportunity cost. Thus, opportunity cost may be defined as the ‘cost of availing an opportunity (Opportunity-2) in terms of the loss of other opportunity (Opportunity-1)’. In other words, opportunity cost is the cost of shifting resources from one use (one opportunity) to the other (other opportunity). It is equal to the loss of output in Use-1 when resources are shifted from Use-1 to Use-2.
Total and Marginal Opportunity Cost:
It refers to total loss of output when the given resources are shifted from Use-1 (Opportunity-1) to Use-2 (Opportunity-2).
Example – If the given land is shifted from the production of Crop-1 to the production of Crop-2 and the loss of output of Crop-1 = 10 tonnes, then the total opportunity cost of shifting resources from one opportunity to the other (from Crop-1 to Crop-2) = Total loss of output of Crop-1 = 10 tonnes.
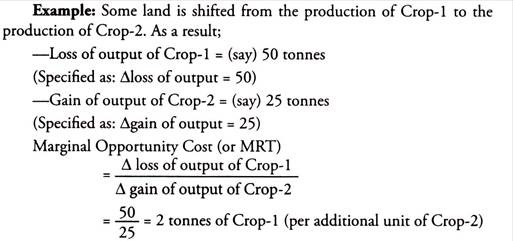
Marginal Opportunity Cost (also Called MRT- Marginal Rate of Transformation):
It refers to opportunity cost per unit of additional output of Crop-2 when some resources are shifted from one opportunity to the other (from Crop-1 to Crop-2).
![]()
Total opportunity cost and marginal opportunity cost are diagrammatically illustrated, as in Fig. 10.
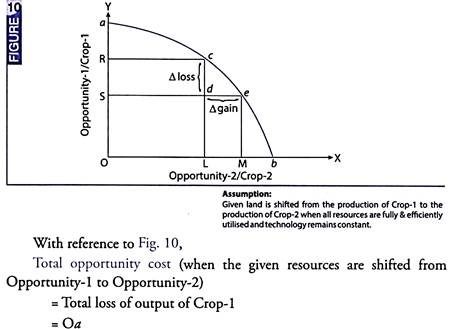
Marginal opportunity cost (when some resources are shifted from Opportunity-1 to Opportunity-2)
Marginal Opportunity Cost and Total Opportunity Cost—The Difference:
(1) Marginal Opportunity Cost:
(i) Marginal opportunity cost is the ratio between loss of output and gain of output when some resources are shifted from Use-1 to Use-2.
(ii) Marginal opportunity cost indicates the cost of one more unit of output (or an additional unit of output) when some resources are shifted from Use-1 to Use-2.
(2) Total Opportunity Cost:
(i) Total opportunity cost is not the ratio. It refers to total loss of output when some resources are shifted from Use-1 to Use-2.
(ii) Total opportunity cost indicates the cost of all the units produced when some resources are shifted from Use-1 to Use-2.
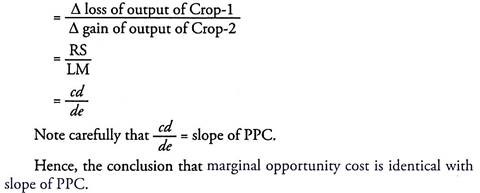
Slope of PPC:
PPC shows two characteristics:
(i) It slopes downward from left to right, and
(ii) It is concave to the point of origin.
PPC slopes downward because with the given resources (and constant technology) increase in output of Good-2 is possible only when there is decrease in output of Good-1. Thus, in Fig. 10, when output of Crop-2 increases by LM (= OM – OL), output of Crop-1 decreases by RS (= OR – OS).
Why PPC is Concave to the Origin?
Here, note the following points carefully:
(i) When a curve is concave to the origin, it means that it has an increasing slope, as we move along this curve, from left to right.
(ii) Since slope of PPC = Marginal opportunity cost, increasing slope implies increasing marginal opportunity cost.
Accordingly, it is concluded that PPC is concave to the origin, because as more and more resources are shifted from Opportunity-1 to Opportunity-2, marginal opportunity cost tends to rise.
Why does Marginal Opportunity Cost (or MRT) tend to rise?
Let us take an illustration:
Let us assume that entire farming land in an island is used for the production of coconuts. Simply because it is best suited for this crop. For their staple food (say rice), the people of this island are dependent on imports. Over time, the import of rice becomes difficult. Accordingly, the people of the island decide to produce some rice in their own island.
They decide to shift 10 hectares of land from the production of coconuts to the production of rice. The villagers would see to it that this land (10 hectares) is such where the loss of output (of coconuts) is minimum. Let us assume that the loss of output = 20 tonnes of coconuts.
Now, there is a need to grow more rice. It would compel the farmers to shift more land from coconuts to rice. Now, land which is more fertile for the production of coconuts has to be used (because the less fertile has already been used). Accordingly, when another 10 hectares are shifted from coconuts to rice, loss of output must be higher than before.
Say, now it is 30 tonnes of coconuts (instead of 20 earlier).Continuing this exercise, we shall find that the loss of output of coconuts would keep increasing as more and more land is shifted from coconuts to rice. Increasing loss of output implies increasing marginal opportunity cost.
Now, the answer to the question (why marginal opportunity cost tends to rise) may be given as under:
Marginal opportunity cost tends to rise, because’ as resources are continuously shifted from Opportunity-1 to Opportunity-2, their existing specialized use is disturbed. When the specialized use of resources (use of resources where their productivity is high) is increasingly disturbed, the loss of output (indicating marginal opportunity cost) must also be increasing.
Answer to the following question should clarify this point further:
An economy produces tow goods- Maggi and Pasta. The following table summarizes its production possibilities. Calculate the marginal opportunity cost of producing more pasta in place of maggi at various combinations. What does it indicate? Draw the Production Possibility Curve. What is the shape of the curve?
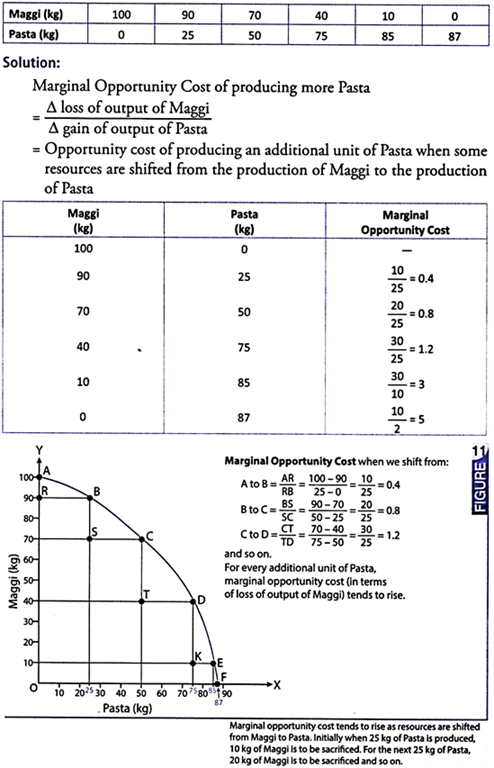
The curve (Fig. 11) is downward sloping and concave to the origin. The rising opportunity cost reflects that as more and more Maggi (kg) is sacrificed for additional Pasta, the in terms of Maggi (kg) per unit of Pasta (in kg) produced rises.