The following points highlight the three effects of changes in demand and supply on the equilibrium price and quantity.
Effect # 1. Change in Demand:
Change in demand refers to an increase (or decreases) in demand following a rise (or fall) in consumer’s money income, tastes and preferences, etc. Under the circumstances, own price of the commodity remains fixed. Thus, change in demand means shifting of the demand curve—either in the upward or in the downward direction.
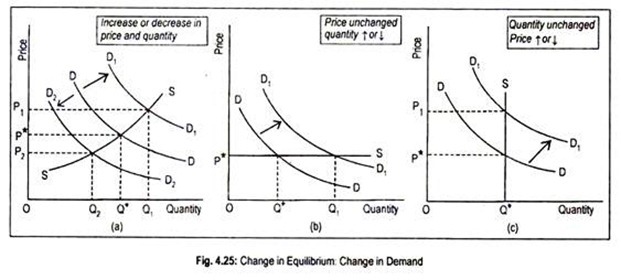
In Fig. 4.25, we have shown how equilibrium price and quantity change when demand curve shifts. In Fig. 4.25(a) initial price and quantity determined by the intersection of DD and SS curves are OP and OQ, respectively.
If demand increases, demand curve will shift to D1D1 and the new equilibrium price will rise to OP1and quantity demanded and supplied will increase to OQ1. Similarly, when demand curve shifts downward to D2D2, price and quantity decline to OP2 and OQ2, respectively.
ADVERTISEMENTS:
In Fig. 4.25(b), the supply curve has been assumed to be perfectly elastic. Initial equilibrium price and quantity are represented by OP and OQ, respectively. Now an increase or decrease in demand will not cause equilibrium price (OP) to change. An increase in demand will only cause equilibrium quantity to rise to OQ1.
If the supply curve is drawn perfectly inelastic [as in Fig. 4.25(c)] an increase in demand will cause price to rise to OP1. Equilibrium quantity will remain the same (OQ).
Effect # 2. Change in Supply:
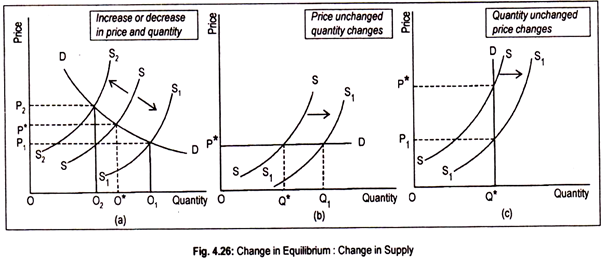
By change in supply, we mean shifting of the supply curve. If supply increases (or decreases) supply curve will shift rightward (or leftward). In Fig. 4.26(a), OP* is the initial equilibrium price and OQ* the equilibrium quantity.
ADVERTISEMENTS:
Now, suppose supply increases and the new supply curve S1S1 intersects the demand curve. As a result, equilibrium price drops to OP1 and the equilibrium quantity demanded and supplied increases to OQ2. Similarly, a fall in supply results in an opposite effect.
In Fig. 4.26(b), the intersection between perfectly elastic demand curve and the SS supply curve determines equilibrium price OP* and equilibrium quantity OQ*. As supply increases, supply curve shifts to S1S1. As a result, equilibrium quantity rises to OQ1, but equilibrium price remains unchanged at OP*.In Fig. 4.26(c), a perfectly inelastic demand curve has been drawn.
Initial equilibrium price and quantity are OP* and OQ*, respectively. Increase in supply means shifting of the supply curve to S1S1. However, new equilibrium price declines to OP1, while equilibrium quantity remains stationary at OQ*.
Effect # 3. Change in Both:
ADVERTISEMENTS:
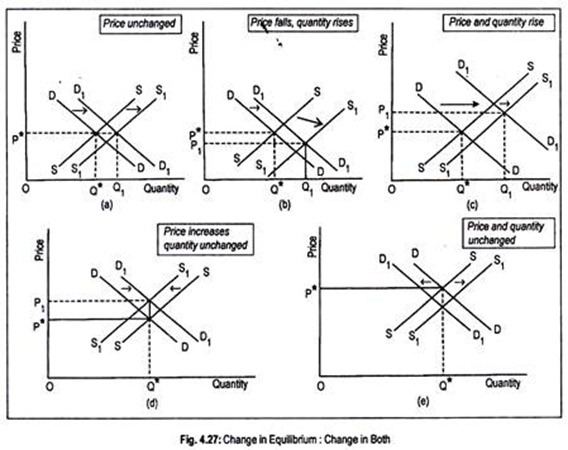
Finally, if both demand and supply increase (or decrease) by the same amount equilibrium price will remain unchanged at OP*, but equilibrium quantity will increase (decrease) as shown in Fig. 4.27(a). If increase in supply is greater than the increase in demand as in Fig. 4.27(b), new equilibrium price will be lower than the initial price.
Equilibrium quantity will increase. Or if increase in demand is greater than the increase in supply as in Fig. 4.27(c), equilibrium price and equilibrium quantity will be higher than the initial situation.
Increase in demand and decrease in supply will lead to an increase in price [Fig. 4.27(d)], but equilibrium quantity may increase or decrease. However, equilibrium quantity may remain unchanged at OQ* if increase in demand is offset by a decrease in supply by the same amount.
Same conclusion holds if decrease in demand and increase in supply take place [Fig. 4.27(e)]. Anyway, how much equilibrium quantities and equilibrium price will undergo a change largely depends on the elasticities of demand and supply.


