
In every economic field the market of labour is affected by the demand and supply powers. The supply of labour is considered on the basis of population, different age groups, participation of sex ratio and their education.
Supply of labour is related with that quantity and rate at which the labourers are ready to work.
According to Rees following are four factors which affect the supply of labour: 1. Participation Rate as Labour Force 2. Number of Hours the Labourers is Willing to Work 3. Speed or Intensity of Work 4. Efficiency or Skill of Work.
Factor # 1. Participation Rate as Labour Force:
Normally the number of labourers is based on the population. How much percentage does really work. It depends on the persons of 14 to 60 years age which is totally based on the ratio of population.
ADVERTISEMENTS:
The industrialised countries prove that:
(i) When there is progress in national income, and
(ii) High age people comparatively stop the work at low age.
As for the question of first stage, the real reason is increasing at the level of education. For second stage, keeping the social security in mind they do not want to do the work after retirement. In under developed economy the quantity of aged labourers is always low in both agricultural and industrial sector.
ADVERTISEMENTS:
As per the diagram, it is clear that in under developed countries, there is a rapid decline of average life time earning profile of labours in comparison to developed countries. According to Standing, “In the early stages, there is a fairly rapid decline in the participation rates of the youngest and oldest age groups; but once those declines have taken place any subsequent decline in the overall, or crude male participation rate is slight.”
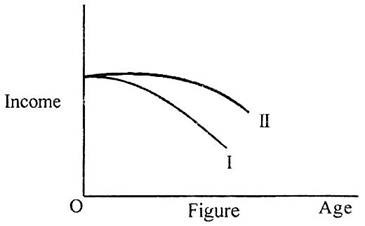
In this figure, on the basis of imagination, the average life time earning profiles is drawn where (I) is for under developed countries, and (II) for developed countries.
In the Indian economy the participation of Labour power is shown on the basis of received data of census.
ADVERTISEMENTS:
In the following table the data are given from 1901 to 1981:
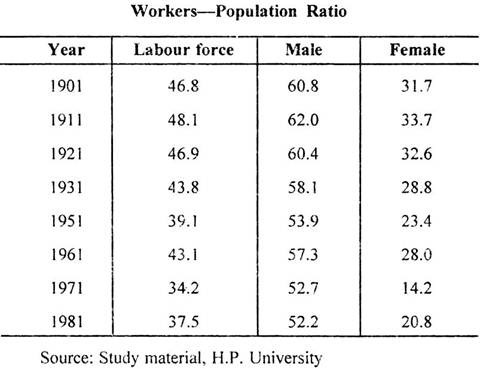
Pandey searched the reasons of difference of participation rate regarding workers. He assumed the size of work field, literacy rate, sex ratio, increase in population rate and the participation ratio of women. According to Pandey’s analysis there is a proper impact of literacy rate, increase in population rate and women participation rate on all over the participation of city. But he did not stress on the participation rate of rural areas.
According to Pandey increase in employment and income inspires the rural people. Especially children, ladies and old people remove them from effective labour power. Reddy has analysed the participation of women to work in the rural areas. According to Reddy the average income of men who are involved in agriculture sector affects the participation of ladies in work. The ladies whose husbands are working in industrial sector their participation ratio is low.
Factor # 2. Number of Hours the Labourers is Willing to Work:
The second aspect of supply of labour is hours of work or time. Supply of labour cannot be determined without knowing that how many hours the work is done. The working hours have been reduced with the movement in labour organisations and the supply has been affected.
Due to this change, the supply of labour will automatically be changed. The supply became low when the working hours are increased and if the hours are decreased the supply will increase.
We are taking some assumptions to study the working population of supply of labour:
(a) There is a difference between market work and non- market activities.
(b) In both works the decision for allotment of time is taken on personal basis.
ADVERTISEMENTS:
On the above assumptions in the market work and non-market activities, the utility maximization tendency solution of person is balanced through the budget constraint. It can be seen by this diagram.
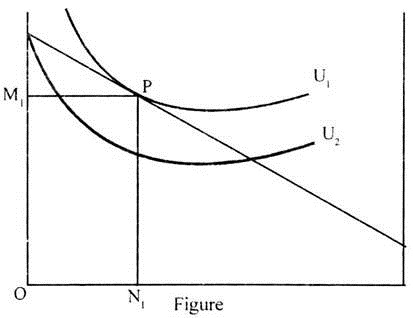
Utility Maximisation Tendency Solution:
ADVERTISEMENTS:
On OM axis the utility received from market work is shown and on ON axis the utility received from non-market work is shown. Market and non-market work describes the level of satisfaction.
On the level of satisfaction utility curve (U1) shows the negative trend that the deficiency received from the market work can be set by getting the excess progress made in non-market sector. Or it can be reciprocal. U1 curve shows the low utility level and U1 curve shows the high utility level.
Maximum utilization state is shown by budget line AB and utilization curve is shown by U1, which touches at point P.
Now we will differentiate between enterprises and effect of Income due to the increase in labour rate under market activities. Increase in market activities relates with the increase in the labour rate and in this way there will be increase in market activities.
ADVERTISEMENTS:
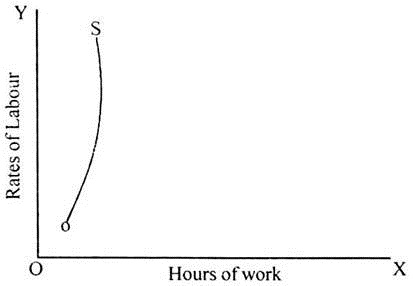
Side by side due to increase in labour rate there will be increase in real income of person, which he will spend on non-market activities. In this way, increase in labour rate will affect the market activities in both ways. When income impact is more powerful than subsidiary effect then curve of labour will be seen high up from left to right. It can be seen from the following picture.
Factor # 3. Speed or Intensity of Work:
Speed of work controls the quantity of labour. One labour who works at a double speed completes the supply of other labourer. This speed depends on various factors. Education, health, climate and others put impact on this tendency of work. We can change the speed knowingly.
Factor # 4. Efficiency or Skill of Work:
Skill of work is related with the kind of work that how much wastage is done, how many accidents are committed and many other factors are considered to know the efficiency of work.
Prof. Wilbut Boor has put the four factors in to a formula which are number of workers. Hours of work, Speed of work and skill of work.
Productivity of labour = N × H × T × S
ADVERTISEMENTS:
Where,
N = Number of workers
H = Hours of work
T = Time taken for work
S = Skill of work
Among the above factors, if there is increase in any factor, there will be increase in productivity. In the modern time some new factors has been introduced like increase in number of workers, increase in the skill of work but there is a decrease in the time of work.
ADVERTISEMENTS:
As far as the supply curve is concerned, in a business firm or industry under sort term the curve of labour supply remain upward rising. In the long term the curve will be downward but its curve will be less than upward. In the developed countries the supply curve will be in a position of leisure and looks backward bending.
In under developed countries, such supply curve looks as same due to institutional pressure. Except this in underdeveloped countries, in some areas of social development it is found completely flexible in the primary steps.
On this hypothesis we will think that in developed countries the curve of Labour supply is very flexible especially in agricultural sector. This hypothesis is attached with the name of Lewis which is developed by Fei and Rains.
According to Lewis:
1. In many economies the life strategy of wages is based on the unlimited supply of labour.
2. In such economies labourers, agriculture, casual labour, petty trade, domestic services are received. In most of the area’s population is more than the resources.
ADVERTISEMENTS:
3. Such economies, in the capitalistic sector employment are increased when there is increase in capital formation.
4. In capital formation and industrial progress the portion of profit in national income increased but there is no increase in the wages.
In India, under Five year plans the labour power, and unemployment is estimated on the basis of usual status concept, weekly status concept and on daily status concept.