
To see the relation between production and cost in the short run, let us consider Table 1. In this case there is only one variable input, viz., labour. Columns 1 and 2 of Table 1 show the points on the production function for three and four units of labour, which can produce respectively 32 and 40 units of output. The average and marginal products are shown in columns 3 and 4. (In fact, the cost functions are based on and derived from the production functions.)
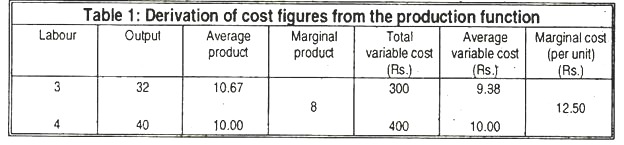
Assume the wage rate is Rs.100 per worker. Thus, hiring three workers to produce 32 units of output gives a total variable cost of Rs.300, shown in column 5. Similarly, producing 40 units of output with four workers costs Rs.400. Clearly, the average variable cost at an output of 40 units is TVC/Q = Rs.400/40 = Rs.10.
But, we can write total variable cost as the price per worker (Rs: 100) times the number of workers, four. We can also write total output, Q, as the average product, 10, times the number of workers, and four. Thus, we can define average variable cost as
ADVERTISEMENTS:
AVC = TVC/Q = Rs. 100 x 4/10 x 4 = Rs. 100/10 = w/AP = Rs. 10
We can show a similar relation between marginal cost and marginal product. The marginal cost of adding an additional worker to produce an additional 8 units of output is ∆TVC/∆Q = Rs.100/8 = Rs.12.50. Note that the change in variable cost from producing the additional 8 units of output is the cost of hiring the additional unit of labour, Rs.100. The additional output is simply the marginal product of the additional worker, 8.
Thus, we can write marginal cost as:
MC = w/MP = Rs 100/8 = Rs. 12.50
ADVERTISEMENTS:
Thus, we see that when only one input is variable in the short run.
The following relations must hold:
AVC = w/AP, MC = w/MP
From these relations, we can determine the shapes of the average variable cost and marginal cost curves. When average product is increasing, AVC is decreasing. When average product is decreasing, AVC is increasing. Therefore, since average product first increases, reaches a maximum, then decreases, AVC first decreases, reaches its minimum (when average product attains its maximum), and then increases. The shape of the average product curve leads to a U-shaped AVC curve.
ADVERTISEMENTS:
From the second relation, as marginal product rises, marginal cost falls; when marginal product declines, marginal cost rises. Marginal cost attains its minimum point when marginal product attains its maximum.
The same type of reasoning can be expanded to consider a firm operating in the short run with several variable inputs. The average products of some inputs may be increasing while those of others are decreasing. But, with some inputs fixed, the decreasing average products must begin to increase.
Eventually all average products must decline since the usage of some inputs is fixed. By the same reasoning, a similar situation holds for the relation between marginal product and marginal cost when several inputs are used. Eventually declining marginal products must cause marginal cost to rise.