The following article will guide you about how to derive the supply curve of the firm.
The supply curve is usually upward sloping from left to right, indicating that, as price increases, a greater quantity of the product will be supplied.
(i) The supply curve of the firm:
The supply curve shows the relation between quantity supplied and market price. For each given price we have to see what quantity will be supplied. Suppose, that a price is specified. Now we have to determine how much each firm will be desirous of supplying. Next, a different price is specified and quantity supplied is again determined—and we have to repeat the exercise under all possible prices. For prices above AVC, the firm will equate price and marginal cost in a competitive situation.
ADVERTISEMENTS:
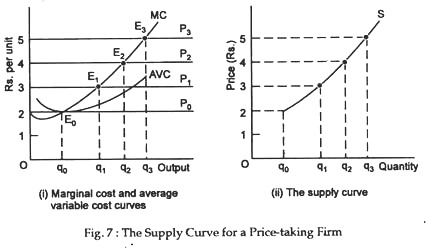
Thus, in perfect competition, the segment of the firm’s marginal cost curve that is above the AVC curve is the price-taking firm’s supply curve. This point is illustrated in Fig. 7.
The market supply curve is a summation of all .the individual supply curves of the firms in the industry and so that too will slope upwards from left to right, indicating that, as price rises, quantity supplied will increase, assuming no change in factor prices as the output of the industry expands.
Here point E0, where price p0 equals AVC, is the shut-down point. For prices below Rs. 2, optimum output is zero, because the firm can fare better by producing zero units, rather than a positive quantity. As prices rise from Rs. 2 to Rs. 3 to Rs. 4 to Rs. 5, the firm increases its production from q0 to q1 to q2 to q3. If, e.g., price were Rs. 3, the firm would produce q1 units because, by doing so, it would be able to cover not only variable cost but also a portion of fixed cost.
ADVERTISEMENTS:
The firm’s supply curve, shown in (ii), relates market price to the quantity the firm will produce and offer for sale. It has the same shape as the firm’s MC curve for all prices above its AVC curve.
(ii) The supply curve of the industry:
Figure 2 illustrates the derivation of an industry supply curve for an example of only two firms.
The important point to note here is:
ADVERTISEMENTS:
The supply curve for a competitive industry is just the horizontal sum of the marginal cost curves of all the individual firms belonging to the industry.
This supply curve, based as it is on the short-run marginal cost curves of the firms in the industry, is the industry’s short-run supply curve.
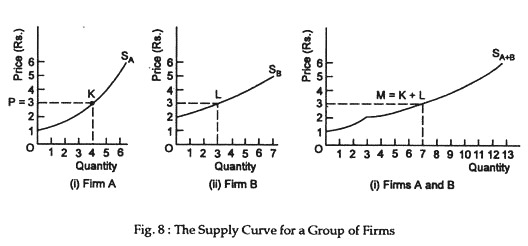
Fig. 8 shows that at a price of Rs. 3, firm A would supply 4 units and firm B would supply 3 units.
Together, as shown in:
(iii) They would supply 7 units. In this example, because firm B does not enter the market at prices below Rs. 2, the supply curve SA+B is identical to SA up to price Rs. 2 and is the sum of SA+SB above Rs. 2.
If there are hundred identical firms, all alike in size, efficiency and capital structure, the industry supply curve would simply be a hundred-fold extension of the supply curve of an individual firm. Thus, if at a particular price a firm offers 10 units for sale, the quantity supplied by the industry will be 1,000 units.


