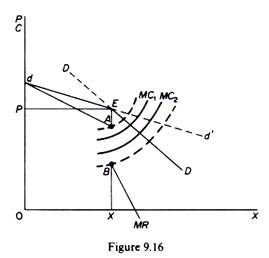
The kinked-demand curve as a tool of analysis originated from Chamberlin’s intersection of the individual dd curve of the firm and its market-share curve DD’.
However, Chamberlin himself did not use ‘kinked-demand’ in his analysis.
Hall and Hitch in their famous article ‘Price Theory and Business Behaviour” used the kinked-demand curve not as a tool of analysis for the determination of the price and output in oligopolistic markets, but to explain why the price, once determined on the basis of the average-cost principle, will remain ‘sticky.’ That is, Hall and Hitch use the kinked-demand curve in order to explain the ‘stickiness’ of prices in oligopolistic markets, but not as a tool for the determination of the price itself, which is decided on theaverage-cost principle .
However, in the same year (1939), P. Sweezy published an article in which he introduced the kinked-demand curve as an operational tool for the determination of the equilibrium in oligopolistic markets. His model, which still holds (surprisingly) an important position as an ‘oligopoly theory’ in most textbooks, may be presented as follows.
ADVERTISEMENTS:
The demand curve of the oligopolist has a kink (at point E in figure 9.16), reflecting the following behavioural pattern. If the entrepreneur reduces his price he expects that his competitors will follow suit, matching the price cut, so that, although the demand in the market increases, the shares of competitors remain unchanged. Thus for price reductions below P (which corresponds to the point of the kink) the share-of-the- market-demand curve is the relevant curve for decision-making.
However, the entrepreneur expects that his competitors will not follow him if he increases his price, so that he will lose a considerable part of his custom. Thus for price increases above P, the relevant demand curve is the section dE of the dd’ curve. The upper section of the kinked-demand curve has a higher price elasticity than the lower part. Due to the kink in the demand curve of the oligopolist, his MR curve is discontinuous at the level of output corresponding to the kink. The MR has two segments segment dA corresponds to the upper part of the demand curve, while the segment from point B corresponds to the lower part of the kinked-demand curve.
The equilibrium of the firm is defined by the point of the kink because at any point to the left of the kink MC is below the MR, while to the right of the kink the MC is larger than the MR. Thus total profit is maximised at the point of the kink. However, this equilibrium is not necessarily defined by the intersection of the MC and the MR curve. Indeed in general the MC passes somewhere through the discontinuous segment AB, and in that sense one might argue that, although marginalistic calculations are behind the ‘kink-equilibrium,’ the kinked-demand curve is a manifestation of the breakdown of the basic marginalistic rule according to which the price and output level that maximize profit are defined by equating MC with MR.
ADVERTISEMENTS:
Intersection of the MC with the MR segments requires abnormally high or abnormally low costs, which are rather rare in practice. The discontinuity (between A and B) of the MR curve implies that there is a range within which costs may change without affecting the equilibrium P and X of the firm.
In figure 9.16, so long as MC passes through the segment AB, the firm maximizes its profits by producing P and X. This level of price and output is compatible with a wide range of costs. Thus the kink can explain why price and output will not change despite changes in costs (within the range AB defined by the discontinuity of the MR curve). The greater the difference of elasticities of the upper and lower parts of the kinked-demand curve, the wider the discontinuity in the MR curve, and hence the wider the range of cost conditions compatible with the equilibrium price P and output X.
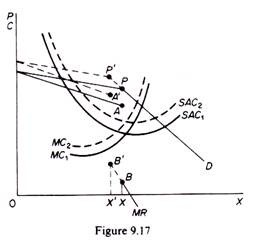
There is only one case in which a rise in cost will most certainly induce the firm to increase its price when costs rise, despite the fact that the higher costs pass through the discontinuity of the MR curve. This occurs when the rise in costs is general (for example, imposition of a sales tax) and affects all firms equally. Under these circumstances the firm will increase its price with the certainty that the others in the industry will follow, since their costs are similarly affected.
The point of the kink shifts upwards to the left, and equilibrium is established at a higher price and a lower output (figure 9.17). The firms, via independent action, move closer to the point of joint profit maximization. Furthermore there is a range through which demand may shift without a change in price although quantity will change.
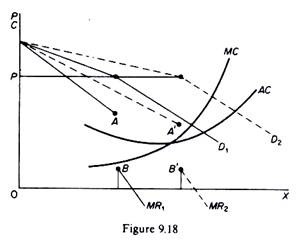
If the demand curve is kinked, a shift in the market demand upwards or downwards will affect the volume of output, but not the level of
price, so long as the cost passes within the range of the discontinuity of the new MR. In this case the shift occurs along the same price line (figure 9.18). As the market expands, the firm will not raise its price, because its (given) cost continues to pass through the discontinuity of the new MR curve and hence there is not incentive to change P, although output will increase.
Prima facie the kinked-demand hypothesis appears attractive. The behavioural pattern implied by the kink seems quite realistic in the highly competitive business world which is dominated by strongly competing oligopolists. However, this model does not explain the price and output decisions of the firms. It does not define the level at which price will be set in order to maximise profits. The kinked-demand curve can explain the ‘stickiness’ of prices in a situation of changing costs and of high rivalry.
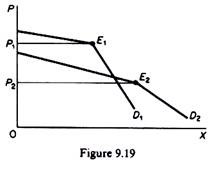
The kink is the consequence (manifestation) of the uncertainty of the oligopolists and of their expectations that competitors will match price cuts, but not price increases. However, it does not explain the level of the price at which the kink will occur. In figure 9.19 we depict two kinked-demand curves, with the kink occurring at a different price level.
Sweezy’s ‘theory’ cannot define which of the two kinks (that is, which one of the two prices) will materialize. The kinked-demand hypothesis does not explain the height of the kink. Hence, it is not a theory of pricing, but rather a tool for explaining why the price, once determined in one way or another, will tend to remain fixed. In view of the above criticism, it is indeed surprising that most textbooks of microeconomics still discuss at length the kinked-demand model and present it as the most relevant ‘theory’ of price determination in oligopolistic markets.


