Under oligopoly, prices and output are indeterminate. Moreover, organizations are mutually dependent on each other in setting the pricing policy.
Therefore, economists found it extremely difficult to propound any specific theory for price and output determination under oligopoly.
In the words of Maurice, “there is no theory of oligopoly in the sense that there is a theory of perfect competition or of monopoly. There is no unique general solution but merely many different behavioral models, each of which reaches a different solution.” Thus, the economists have developed various analytical models based on different behavioral assumptions for determining price and output under oligopoly.
Figure-1 shows different oligopoly models:
Let us discuss different oligopoly models (as shown in Figure-1).
1. Sweezy’s Kinked Demand Curve Model:
The kinked demand curve of oligopoly was developed by Paul M. Sweezy in 1939. Instead of laying emphasis on price-output determination, the model explains the behavior of oligopolistic organizations. The model advocates that the behavior of oligopolistic organizations remain stable when the price and output are determined.
This implies that an oligopolistic market is characterized by a certain degree of price rigidity or stability, especially when there is a change in prices in downward direction. For example, if an organization under oligopoly reduces price of products, the competitor organizations would also follow it and neutralize the expected gain from the price reduction.
On the other hand, if the organization increases the price, the competitor organizations would also cut down their prices. In such a case, the organization that has raised its prices would lose some part of its market share.
ADVERTISEMENTS:
The kinked demand curve model seeks to explain the reason of price rigidity under oligopolistic market situations. Therefore, to understand the kinked demand curve model, it is important to note the reactions of rival organizations on the price changes made by respective oligopolistic organizations.
There can be two possible reactions of rival organizations when there are changes in the price of a particular oligopolistic organization. The rival organizations would either follow price cuts, but not price hikes or they may not follow changes in prices at all.
A kinked demand curve represents the behavior pattern of oligopolistic organizations in which rival organizations lower down the prices to secure their market share, but restrict an increase in the prices.
Following are the assumption of a kinked demand curve:
ADVERTISEMENTS:
i. Assumes that if one oligopolistic organization reduces the prices, then other organizations would also cut their prices
ii. Assumes that if one oligopolistic organization increases the prices, then other organizations would not follow increase in prices
iii. Assumes that there is always a prevailing price
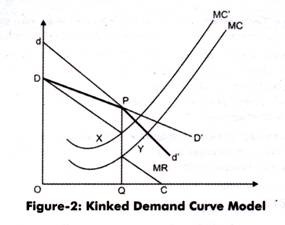
A kinked demand curve model is explained with the help of Figure-2:
The slope of a kinked demand curve differs in different conditions, such as price increase and price decrease. In this model, every organization faces two demand curves. In case of high prices, an oligopolistic organization faces highly elastic demand curve, which is dd’ in Figure-2.
On the other hand, in case of low prices, the oligopolistic organization faces inelastic demand curve, which is DD’ (Figure-2). Suppose the prevailing price of a product is PQ, as shown in Figure-2. If one of the oligopolistic organizations makes changes in its prices, then there can be three reactions of rival organizations.
Firstly, when the oligopolistic organization would increase its prices, its demand curve would shift to dd’ from DD’. In such a case, consumers would switch to rivals, which would lead to fall in the sales of the oligopolistic organization. In addition, the dP portion of dd’ would be more elastic, which lies above the prevailing price.
On the other hand, if price falls, the rivals would also reduce their prices, thus, the sales of the oligopolistic organization would be less. In such a case, the demand curve faced by the oligopolistic organization is PD’, which lies below the prevailing price.
ADVERTISEMENTS:
Secondly, rival organizations will not react with respect to changes in the price of the oligopolistic organization. In such a case, the oligopolistic organization would face DD’ demand curve.
Thirdly, the rival organizations may follow price cut, but not price hike. If the oligopolistic organization increases the price and rivals do not follow it, then consumers may switch to rivals. Thus, the rivals would gain control over the market. Thus, the oligopolistic organization would be forced from dP demand curve to DP demand curve, so that it can prevent losing its customers.
This would result in producing the kinked demand curve. On the other hand, if the oligopolistic organization reduces the price, the rival organizations would also reduce prices for securing their customers. Here, the relevant demand curve is Pd’. The two parts of the demand curve are DP and Pd’, which is DPd’ with a kink at point P.
Let us draw the MR curve of the oligopolistic organization. The MR curve would take the discontinuous shape, which is DXYC, where DX and YC correspond directly to DP and Pd’ segments of the kinked demand curve. The equilibrium point is attained when MR = MC. In Figure-2, the MC curve intersects MR at point Y where at output OQ.
ADVERTISEMENTS:
At point Y, the organization would achieve maximum profit. Now, if cost increases, the MC curve would move upwards to MC. In such a case, the oligopolistic organization cannot increase the prices. This is because if the organization would increase the prices, the rival organizations would decrease their prices and gain the market share. Moreover, the profits would remain same between point X and Y. Thus, there is no motivation for increasing or decreasing prices. Therefore, price and output would remain stable.
However, kinked demand curve model is criticized by various economists.
Some of the major points of criticism are as follows:
i. Lays emphasis on price rigidity, but does not explain price itself.
ADVERTISEMENTS:
ii. Assumes that rival organizations only follow price decrease, which does not hold true empirically.
iii. Ignores non-price competition among organizations. Non-price competition can be in terms of product differentiation, advertising, and other tools used by organizations to promote their sales.
iv. Ignores the application of price leadership and cartels, which account for larger share of the oligopolistic market.
2. Collusion Model-The Cartel:
In oligopolistic market situations, organizations are indulged in high competition with each other, which may lead to price wars. For avoiding such type of problems, organizations enter into an agreement regarding uniform price-output policy. This agreement is known as collusion, which is opposite to competition. Under collusion, organizations are involved in collaboration with each other to take combined actions for keeping their bargaining power stronger against consumers.
Some of the popular definitions of collusion are as follows:
According to Samuelson, “Collusion denotes a situation in which two or more firms jointly set that prices or output, divide the market among them, or make other business decisions.”
ADVERTISEMENTS:
In the words of Thomas J. Webster, “Collusion represents a formal agreement among firms in an oligopolistic industry to restrict competition to increase industry profits.”
Collusion helps oligopolistic organizations in many ways.
Some of the benefits of collusion are as follows:
i. Helps organizations to increase their performance
ii. Helps organizations in preventing uncertainties
iii. Provides opportunities to prevent the entry of new organizations
ADVERTISEMENTS:
The agreement of collusion formed may be tacit or formal in nature. A formal agreement formed among competing organizations is known as cartel. In other words, cartel can be defined as a group of organizations that together make pricing and output decisions.
Some of the management experts have defined cartel in the following ways:
According to Leftwitch, “the firms jointly establish a cartel organization to make price and output decisions, to establish production quotas for each firm, and to supervise market activities of the firms in the industry.”
According to Khemani and Shapiro, “Cartels are productive structures involving multiple producers acting in unison that allow producers to exercise monopoly power.”
In the words of Boyce and Melvin, “A cartel is an organization of independent firms, whose purpose is to control and limit production and maintain or increase prices and profits.”
According to Webster, “A cartel is a formal agreement among firms in an oligopolistic industry to allocate market share and/or industry profit.”
ADVERTISEMENTS:
Under cartels, the price and output determination is done by the common administrative authority, which aims at equal profit distribution among all member organizations under cartel. The total profits are distributed in proportion as decided among member organizations. The most famous example of cartel is Organization of the Petroleum Exporting Countries (OPEC), which has shared control of petroleum markets.
Let us understand price and output decisions under cartels with the help of an example. Assume that there are two organizations that have formed a cartel.
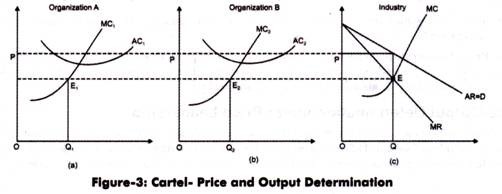
The price and output decisions of these two organizations are shown in Figure-3:
In Figure-3 (c), AR is the aggregate demand curve of both the organizations and MC curves are the addition of MC1 and MC2 curves of organizations A and B, respectively. The total output of industry is determined according to MR and MC of the industry. In Figure-3 (c), OQ and OP are the equilibrium price and output of the industry.
Now, this output will be allocated among the organizations. This can be done by drawing a horizontal line from equilibrium point E of industry, towards MC curves of organizations A and B. The points of intersection E1 and E2 are the equilibrium levels of the organizations, A and B, respectively. OQ1 is the equilibrium output of organization A and OQ2 is the equilibrium output of organization B. Thus, OQ1 + OQ2 = OQ. These levels of outputs ensure the maximum joint profits of member organizations.


