
In this article we will discuss about the effect of subsidy on monopoly.
In the case of a monopoly, the profit is given by the difference between the total revenue, R(q), and the total cost, C(q), where q is the output quantity produced and sold by the monopolist.
Thus, the pre-subsidy profit function of the monopolist is
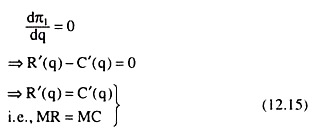
π1 = R(q) – C(q) (12.14)
ADVERTISEMENTS:
The first order condition (FOC) for profit maximisation is given by
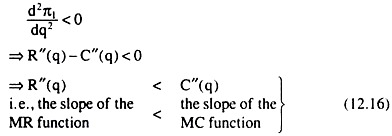
Again, the second order condition (SOC) for profit maximization in a monopoly is

We may now consider the different types of subsidy given by the government, and their effects on the price-output combination in monopoly.
When the subsidy is a fixed amount, irrespective of output.
The profit-function in this case would be
π2 = R(q) – C(q) + S (12.17)
ADVERTISEMENTS:
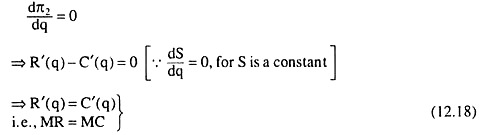
where S is the fixed amount of subsidy.
The FOC for profit maximization, in this case, is
Also, the SOC, in this case, is
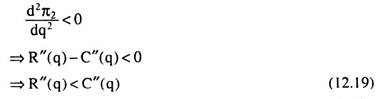
Since conditions (12.18) and (12.19) are the same as conditions (12.15) and (12.16), the equilibrium price-output combination would remain unchanged although a lump-sum subsidy is given to the firm.
When the subsidy is a fixed sum on each unit of output produced.
The profit function in this case would be
π3 = R(q) – C(q) + αq (12.20)
ADVERTISEMENTS:
where α is the fixed amount of subsidy per unit of output.
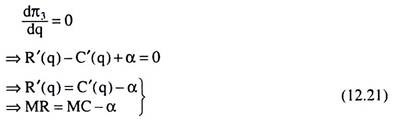
Here the FOC for profit maximization is
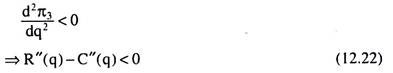
Also, the SOC here is
ADVERTISEMENTS:
From (12.21), it is evident that profit maximising price-output combination would be one for which MR is equal to MC less the amount of subsidy per unit of output. Therefore, as is evident in Fig. 12.10, the output of the monopolist would be larger (qs0 > q0) and the price would be smaller (ps0<p0), when a specific per-unit subsidy is granted to the firm.
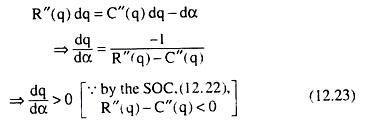
This can be obtained in the following way also. Taking total differential of (12.21), we obtain
ADVERTISEMENTS:
(12.23) gives us that as a rises, q also rises which gives us that grant of a per-unit subsidy would increase the output and, hence, decrease the price of the monopolist’s product (because of the negative slope of the demand or AR curve).

When the subsidy is a fixed percentage of the price of each unit produced and sold.
The profit function in this case would be
π4 = R(q)-C(q) + βp; (0 < β < 1) (12.24)
where β is the fixed percentage of the price that is granted as subsidy.
ADVERTISEMENTS:
The FOC for profit maximisation, in this case, is dπ4/dq = 0
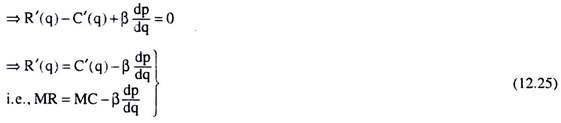
Since dp/dq < 0 under monopoly, (12.25) gives us that the equilibrium output would be one for which MR is greater than MC by –β(dp/dq). It may be noted here that the amount –β (dp/dq) is a positive constant if we assume the demand (AR) curve of the monopolist to be a straight line.
In this case, as is evident in Fig. 12.11, the equilibrium point of the monopolist would move from the MR = MC point at E0 to the MR = MC –β(dp/dq) point at Es0, and along the AR curve, the equilibrium (p, q) combination would move.

from the point F0(p0, q0)to the point Fs0 (ps0,qs0). That is, owing to the subsidy under consideration, the monopolist’s sales would decrease from q0 to qs0 and the price of his product will increase from p0 to ps0.
ADVERTISEMENTS:
Now, the SOC for maximum profit, here, is
![]()
Taking total differential of (12.25), we have
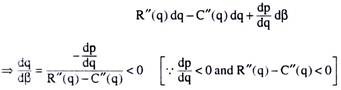
i.e.. owing to the subsidy q will decrease, and so, p will increase.
When the subsidy is an amount per unit of output, which increases as output (produced and sold) increases.
ADVERTISEMENTS:
In this case, the profit function of the monopolist would be
![]()
where α is the amount of subsidy per unit of output.
Here, the FOC for profit-maximisation is
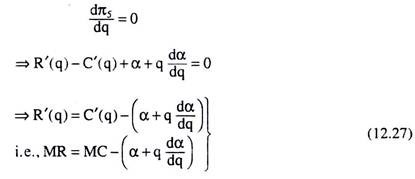
In this case, since a > 0 and dα/dq > 0, equilibrium output would be one for which MR is equal to MC minus a positive quantity which is equal to α + q (dα/dq). Here, as in case (b), illustrated in Fig. 12.10, post-subsidy output would be larger and price smaller than the pre-subsidy output and price.
ADVERTISEMENTS:
Also, the SOC for maximum profit, here, is
![]()
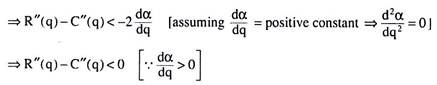
The shapes of the MR and MC curves in Fig. 12.10 satisfy the SOC.