Theory of Excess Capacity under Monopolistic Competition!
The concept of excess capacity is found in the earlier works of Wicksell and Cairnes. P. Sraffa and Mrs. Joan Robinson also outlined it.
But it was Chamberlin who expounded it in a most systematic manner followed by Kaldor, Kahn, Harrod and Cassels.
The doctrine of excess (or unutilised) capacity is associated with monopolistic competition in the long- run and is defined as “the difference between ideal (optimum) output and the output actually attained in the long-run.”
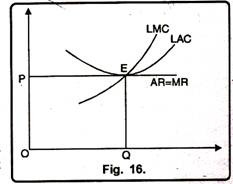
Under perfect competition, however, the demand curve (AR) is tangential to the long-run average cost curve (LAC) at its minimum point and conditions of full equilibrium are fulfilled: LMC = MR and AR (price) = Minimum LAC. This means that in the long-run the entry of new firms forces the existing firms to make the best use of their resources to produce at the point of lowest average total costs. At point E in Figure 16, abnormal profits will be competed away because MR = LMC = AR = LAC at its minimum point E and OQ will be the most efficient output which the society will be enjoying. This is the ideal or optimum output which firms produce in the long-run.
Under monopolistic competition the demand curve facing the individual firm is not horizontal as under perfect competition, but it is downward sloping. A downward sloping demand curve cannot be tangent to the LAC curve at its minimum point.
The double condition of equilibrium LMC = MR = AR (d) = Minimum LAC will not be fulfilled. The firms will, therefore, be of less than the optimum size even when they are earning normal profits. No firm will have the incentive to produce the ideal output, since any effort to produce more than the equilibrium output would involve a higher long-run marginal cost than marginal revenue.
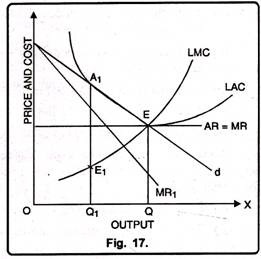
Thus each firm under monopolistic competition will be of less than the optimum size and work under excess capacity. This is illustrated in Figure 17 where the monopolistic competitive firm’s demand curve is d and MR1 is its corresponding marginal revenue curve. LAC and LMC are the long-run average cost and marginal cost curves.
ADVERTISEMENTS:
The firm is in equilibrium at E1 where the LMC curve cuts the MR1 curve from below and OQ1 output is set at the price Q1A1. OQ1 is the equilibrium output but not the ideal output because d is tangent to the LAC curve at A1 to the left of the minimum point E. Any effort on the part of the firm to produce beyond OQ1 will mean losses as beyond the equilibrium point E1, LMC > MR1. Thus the firm has negative excess capacity measured by OQ1 which it cannot utilize working under monopolistic competition.
A comparison of the equilibrium positions under monopolistic competition and perfect competition with the help of Figure 17 reveals that the output of a firm under monopolistic competition is smaller and the price of its product is higher than under perfect competition. The monopolistic competition output OQ1 is less than the perfectly competitive output OQ, and the monopolistic competitive price Q1A1 is higher than the competitive equilibrium price QE. This is because of the existence of excess capacity under monopolistic competition.
Chamberlin’s Concept of Excess Capacity:
Prof. Chamberlin’s explanation of the theory of excess capacity is different from that of ideal output under perfect competition. Under perfect competition, each firm produces at the minimum on its LAC curve and its horizontal demand curve is tangent to it at that point.
ADVERTISEMENTS:
Its output is ideal and there is no excess capacity in the long-run. Since under monopolistic competition the demand curve of the firm is downward sloping due to product differentiation, the long-run equilibrium of the firm is to the left of the minimum point on the LAC curve.
According to Chamberlin, so long as there is freedom of entry and price competition in the product group under monopolistic competition, the tangency point between the firm’s demand curve and the LAC curve would lead to the “ideal output” and no excess capacity.
Assumptions:
Chamberlin’s concept of excess capacity assumes that:
(i) The number of firms is large;
(ii) Each produces a similar product independently of the others;
(iii) It can charge a lower price and attract other’s customers and by raising its price will lose some of its customers;
(iv) ‘Consumers’ preferences are fairly evenly distributed among the different varieties of products;
(v) No firm has an institutional monopoly over the product;
(vi) Firms are free to enter its field of production;
ADVERTISEMENTS:
(vii) The long-run cost curves of all the firms are identical and are U-shaped.
Reasons:
According to Chamberlin, excess capacity arises when there is no active price competition despite free entry of firms in a monopolistic competitive market.
He gives the following reasons for such a situation:
(i) Firms may consider costs rather than demand in fixing prices.
ADVERTISEMENTS:
(ii) They may aim at ordinary profits rather than maximum profits,
(iii) They may follow a policy of ‘live and let live’ and may not resort to price reduction.
(iv) They may have formal or tacit agreements, open price associations, trading association activities in building up an esprit de corps and price maintenance.
(v) There may be the imposition of uniform prices on dealers by manufacturers.
ADVERTISEMENTS:
(vi) Firms may resort to excessive differentiation of the product in an attempt to turn attention away from price cutting.
(vii) Business or professional ethics prevent firms from resorting to active price competition.
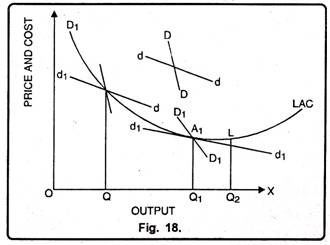
When there is no price competition due to the prevalence of these factors, the curve dd is of no significance and the firms are only concerned with the group DD curve. Suppose the initial short-run equilibrium is at S where the firms are earning supernormal profits because the price OP corresponding to point S is above the LAC curve.
With the entry of new firms in the group, super-normal profits will be competed away. The new firms will divide the market among themselves and the DD curve will be pushed to the left as d1d1 in Figure 18 where it becomes tangent to the LAC curve at point A1, This point A1 is of stable equilibrium in the absence of price competition for all firms in the group and they are earning only normal profits. Each firm is producing and selling OQ output at QA (= OP) price.
In Chamberlin’s analysis, O1 is the ‘ideal output’. But each firm in the group is producing OQ output in the absence of price competition. Thus OQ1 represents excess capacity under non-price monopolistic competition.
ADVERTISEMENTS:
Chamberlin concludes that when over long periods under non-price competition prices do not fall and costs rise, the two are equated by the development of excess productive capacity which does not possess automatic corrective. Such excess capacity may develop under pure competition due to miscalculations on the part of producers or to sudden changes in demand or cost conditions.
But under monopolistic competition it may develop over long periods with impunity, prices always covering costs, and may, in fact become permanent and normal through a failure of price competition to function. The surplus capacity is never abandoned and the result is high prices and wastes. They are the wastes of monopolistic competition.
Significance of Excess Capacity:
The concept of excess capacity is of much practical significance. Prof. Kaldor has characterised it as “intellectually striking”, ‘a highly ingenious’ and ‘revolutionary doctrine.’
1. It demonstrates an untraditional possibility that an increase in supply may lead to a rise in price. The ‘wastes of competition’ which were hitherto a mystery have been unfolded. They pertain to monopolistic competition rather than to perfect competition, as was strongly implied by the earlier economists.
2. It establishes the truth of the proposition that perfect competition and increasing returns are incompatible and proves that falling costs ultimately lead to monopoly or monopolistic competition. When monopolistic competition prevails, the number of firms will be large. But each firm will be of a smaller size than under perfect competition.
3. This entails a wasteful use of resources by bringing up firms with lower efficiency. Such firms may employ more manpower, equipment and raw materials than is necessary. This leads to excess or unutilized capacity.


