
In this article we will discuss about Productivity:- 1. Concept of Productivity 2. Changes in Productivity 3. Measurement 4. Productivity Index Numbers 5. Labour 6. Materials 7. Capital 8. Management Resources.
Contents:
- Concept of Productivity
- Changes in Productivity
- Measurement of Total Productivity
- Productivity Index Numbers
- Productivity of Labour
- Productivity of Materials
- Productivity of Capital
- Productivity of Management Resources
1. Concept of Productivity:
Productivity is often confused with ‘production’. Many have the impression that the greater the production the greater the productivity. Actually it is not so. Production is concerned with the activity of manufacturing goods and services, whereas productivity means efficient utilization of resources (inputs) in the manufacturing of goods and services (outputs).
ADVERTISEMENTS:
Production is the quantity of output and productivity is the ratio of outputs to inputs. Productivity denotes the relationship between output and one or all associated inputs in real terms. It is difficult to measure the productivity of a nation or company because various factors influence the end results.
It is quite easy to say that productivity is output divided by input. But the term ‘output’ is ambiguous since there is no simple way of totalling the products and services.
Again, when we consider inputs we come across diverse factors. In order to produce anything we need people, capital, land, facilities, machine tools, mineral deposits, energy resources, ingenuity, activity, climate, electrical power, organisation, rational price and a host of other factors.
So productivity can be more correctly stated as the relationship between achieving a result and the time it takes to accomplish it. Hence productivity = results/time. Time is a good common denominator. It is the one measurement that is used everywhere and it is beyond the control of people. What each of us can do with our allotted hours determines how productive we are.
ADVERTISEMENTS:
If a carpenter can complete a job in 5 hours and another completes the same job in 10 hours, the former’s productivity is double the latter’s. Improving productivity means compressing more good results into a unit of time. Suppose an operator is producing 100 pencils per hour.
If he now finds ways to improve his output to 150 pencils per hour, one can say that his (or her) productivity has increased by 50%. The improvement has been gained by applying more effort, or a simpler method, or better tools, or a faster machine.
The ratios of output to individual inputs, or classes of inputs, are known as partial productivity ratios. The most common of these is the familiar output-per-labour-hour measure. This is most important inasmuch as wage cost is the major component of total cost in an economy (as also in an individual firm). It is also the major part of value added in most industries.
The partial productivity measures reflect factor substitutions as also changes in productive efficiency. Thus, output-labour ratios reflect not only increases in capital and other non- human resources per labour hour, but also cost- reducing technological innovations.
ADVERTISEMENTS:
If output is related to all relevant inputs, it is possible to measure the net saving in real costs per unit of output, and thus, the increase in productive efficiency.
These measures are known as total productivity ratios. In order to measure gross output we have to consider not only the human (labour) and non-human factors (man-made assets like capital goods, or natural resources including land) but also intermediate goods like the materials, supplies, energy, and other services consumed in the production process.
A variant of the total productivity measure is total factor productivity, in which net output of the intermediate goods purchased and used is measured, and the resulting real value added is related to the inputs or factors of production.
Business managers are interested in the least- cost combination of all inputs: and in conserving overtime in the use of intermediate products and services as well as of factor services, total productivity measure are of interest to firms and industries.
It is clear that the concept of productivity is rooted in the production function concept developed earlier. We noted that the volume of output depends on the volume of inputs used in production and the state of technology.
A technological change will shift the production function to the right. So more output can be produced with the same inputs. Economists often make the use of the Cobb-Douglas production function to illustrate the relation between production and productivity.
2. Changes in Productivity:
Changes in productivity levels are being increasingly recognized as a major influence on a wide range of managerial problems, including wage levels, cost-price relationships, capital investment requirements, labour utilisation and even competitive standing.
Bela Gold has suggested four general conclusions in this context:
ADVERTISEMENTS:
1. “That productivity analysis serves a variety of purposes and hence requires corresponding variety of appropriately designed measures;
2. That the productivity of any activity system should refer not to any single input-output ratio but to an integrated network of such measures;
3. That the effects of productivity adjustments depend not only on their magnitudes, but also on the sources responsible for them, on the nature of the changes in input-output relationships involved, and on managerial choices among alternative means of harnessing their potential benefits; and
4. That evaluation of such effects requires supplementing physical with cost measures and then with successively broader criteria until these reflect the guiding objectives of the system under study”.
ADVERTISEMENTS:
When considering the physical efficiency of the production process in future periods, we should expect the productivities of some of the factors to change over time. Machines and equipment, for example, may be expected to become progressively more efficient in terms of output per hour (or some other criterion) due to technological improvement.
The increasing use of computer-controlled plant and equipment has raised the productivity of capital equipment substantially in recent years.
Similarly, labour productivity might be expected to increase with the passage of time due to the workers’ higher level of education and increased familiarity with mechanical production processes. On the other hand, changes in the attitude towards work or other sociological factors may lead to reduced labour productivity in the future.
If these trends have become apparent in the productivity of the factors of production, we may apply these trends as an estimate of future changes in the efficiency of the physical production process. This extrapolation of productivity trends should be modified by any changes in the productivity of any factor, that may occur due to foreseen events of the irregular nature.
ADVERTISEMENTS:
Productivity, as we have noted, may be defined as follows:
Productivity is the ratio of output to input. This definition applies to a firm, an industry or an economy as a whole.
The most widely used index of national productivity is the one relating output of goods and services to labour-output per man. The national index reports the output attributable to all resources, but describes all effects, not causatively, but in relation to the human factor of production.
In a company, output attributable to labour effect alone can be isolated by means of A sound work measurement or wage incentive programme. But in the national index, all factors are necessarily combined. Capital, management and other resources contribute important shares in the result.
According to an ILO study, productivity is “nothing more than the arithmetical ratio between the amount produced and the amount of any resources used in the course of production”.
These resources may be:
ADVERTISEMENTS:
1. Land
2. Labour
3. Materials
4. Plant, machines and tools, or, a combination of all four.
Sometimes we observe that the productivity of labour, land, materials or machines in any enterprise or establishment has increased. But in most cases we know nothing about the reasons why it has increased. In order to discover the causes of productivity rise we must first of all known how productivity of resources is measured.
As the ILO study has emphasised, an increase in the productivity of labour, for example, may be due to better planning of the work on the part of the management or to the installation of new machinery. In a like manner an increase in the productivity of materials may be due to greater skill on the part of workers, to improved designs, and so on.
3. Measurement of Total Productivity:
ADVERTISEMENTS:
Gross output is measured as a weighted quantity aggregate
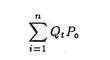
with units of each of the n goods and services produced in the given period t, weighted by the base- period prices P0, or units costs. Kendrick has pointed out that “for production and productivity analysis . . . unit-factor-cost weights are preferable to market prices in measuring relative resource costs, since they are not distorted by indirect business taxes less subsidies”.
However, in practice, market prices are generally used as weights (or as deflators of current values).
Instead of directly weighting quantities, one can obtain the results by using Paasche-type index numbers. This method is preferable if reliable data on quantity are not available but if value and price data are plentiful.
ADVERTISEMENTS:
The same method is followed in estimating both intermediate inputs and outputs (whether the real intermediate costs are deducted from gross output to obtain real value added, or are treated as an input). It is because the intermediate inputs are the outputs of the supply industries.
The usual procedure is to measure labour input as the sum of hours worked. In a like manner non-human resources may be measured in terms of the total real stocks of capital (plant, equipment, inventories, and land) multiplied by the base-period average rate to return. Alternatively the real stocks may be measured by industry and weighted by the base-period rate of return in each.
It is also felt that the real gross stocks of depreciable capital goods are a better measure of output- producing capacity than the net stocks, which reflects the decline in value of fixed capital goods as they grow older. It also becomes necessary to adjust the real stocks and inputs for changes in rate of capacity utilization, which lead to changes in the productivity ratio in different phases of the business cycle.
Real input costs are added up to obtain a measure of total input. This is divided by the real value of output. If we use index numbers of the inputs, we have to weight each index by its base-period proportion of costs to obtain the overall index number of total output. The quotients of index numbers of output and inputs yield index numbers of productivity.
4. Productivity Index Numbers:
Any student of statistics knows that all index numbers are ratios standardized to a base. The base need not necessarily be a point of time or a period. It can be a place such as a country or a factory or a company.
ADVERTISEMENTS:
It is possible to make productivity index for each factory and compare their several trends with one another. A comparison of the several index numbers for a given period would show the relative progress made in them since the base period.
Here we are concerned with preparing productivity index numbers for the same place but for different periods. In preparing productivity index numbers, a labour-weighted production index is used as the numerator and the ratio of labour consumed or used in the given period to that in the base period as the denominator. First, we may consider the numerator.
i. The Labour-Weighted Production Index:
A simple example may be used to illustrate this concept.
Suppose a jam factory in Bhutan has three main processes:
1. Making, including preparing fruits and boiling;
2. Filling into pots each contain 1 lb. of jam; and
3. Capping the pots, labelling, and packaging ready for distribution.
In 1983 the factory makes, fills, caps, etc. 1, 00, 000 lb of jam. In 1984, more sophisticated filling and capping technologies are introduced. This enabled the factory to save labour to a great extent in 1984.
Now it is easy to find out productivity at the process level. If the factory makes 1, 50,000 lb., in 1984, and the size of the labour force increases from 40 men in 1983 to 60 men in 1984 the productivity in the making department remains unchanged.
If the labour force averages 50 men in 1984, then there is an increase in productivity of 20%, the index number for 1984 being 120 to the base 1983 = 100:
Suppose demand is overestimated in 1984. So 1, 50,000 lb. of jam are made and filled into pots then capped and labelled. But the factory succeeds in selling only 1, 20,000 lb. in 1984. Table 27.1 illustrates how to arrive at an overall labour weighted productivity index for the factory. The ratios given in the last column of table 27.1 provide the productivity index numbers process.
![]()

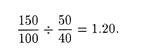
ii. The Labour Ratio as Denominator:
We have furnished details about three processes in table 27.1. Here the appropriate labour ratio is ∑mnqn/∑moqo, which corresponds to the value ratio, where p serves for m. Here the ratio is: 57.5/ 53.0 = 1.085, which is divided into the production index to give the productivity index.
However, as E. J. Broster has pointed out, “if the productivity index for the factory as a whole including warehousing, labour and office staff is required, the total labour force, including these people, in the given and base periods would be used for arriving at the labour ratio to use as the denominator”.
iii. The Productivity Index:
Let us represent the productivity index in the given year to 1.00 in the base year by Mn.o. Then, for the three departments or processes, we have
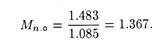
However, since the ratio m0/mn gives the productivity index process by process, weighted for output, they would give a productivity index for the three processes combined.
The index derived from the weighted figures is:
![]()
This is exactly, the same as the figure derived above.
We have the labour weighted production index
![]()

which is the same as the above.
iv. Limitations of the Formula:
It may be noted that equation (27.4) is “limited in its application to the derivation of productivity index numbers, in respect of the labour force accounted for in the process of calculations”.
If, however, an overall productivity index for the factory is required, there is need to apply equation (27.4) in which the labour ratio is the total factory labour force, in the base period divided by that in the given (current) period. Suppose for our hypothetical jam factory the two labour figures are 90 and 100 respectively, then the overall productivity index would be:
90/100 of 1.483 = 1.335.
5. Productivity of Labour:
Labour productivity is measured by an index called output per man-hour. It is defined as total output divided by the number of man-hours worked by all employees. Let us cite an example of productivity of a person to start with. If a tailor has been stitching 3 trousers per day and the purchase of a new machine enables him to stitch 4 trousers a day, one can say that his productivity has increased by 33 1/3%.
Labour productivity is typically measured as “units of output per labour unit, and hence it takes the credit for increases in the productivity of capital factors such as machines and equipment. Labour productivity figures are, therefore, an amalgam of labour and capital productivity, and it may be quite difficult to separate the effects of each”.
Rather than attempting this, we are perhaps better employed searching for trends or patterns in the output per man-hour or some similar index. Data on this measure are frequently available from public sources, and the decision maker may be able to derive estimates of the future productivity of factors based upon these data.
The conventional formula for measuring labour productivity is:

The standard hours or minutes are determined by converting units produced into time, using the standard output rate obtained by work measurement. Where a sound costing system exists and standard costs are accurately determined, a useful measurement of productivity is the standard cost of output as a proportion of actual wages paid.
The standard cost includes all costs which should have been incurred in making a product. Dividing the figure by the actual wages which have been paid, will provide good indication of labour productivity.
There are several factors affecting labour productivity:
i. Non-Labour Input:
J. W. Kendrick has pointed out that “when productivity is measured in terms of output per man- hour, increases in non-labour inputs per hour contribute to productivity gains. If the rate of change in the capital-labour ratio is weighted by the share of capital in factor cost, the resulting rate of substitution of capital for labour exactly explains the difference between the rates of change in labour productivity and in total factor productivity”.
ii. Education and Training:
If labour input is measured in terms of undifferentiated hours worked, then productivity growth can be explained in terms of the effect of increased education and training per worker.
iii. Health and Working Conditions:
The quality of labour is also affected by certain non-economic factors like health of the average worker and working conditions in the factory.
iv. Motivation:
Change in the ratio of actual to potential efficiency is also an important factor. If the potential of the workers is properly exploited, output per man will rise. This factor reflects the skill of management in motivating workers to perform well.
v. Age Distribution:
Change in the age-sex mix may also affect labour productivity, if there is a net shift toward groups with higher or lower average compensation and value added per hour.
vi. Efficiency of Other Factors:
The productivity of labour also depends on the efficiency of other factors. Beyond a certain stage a declining average quantity of land and natural resources (e.g., mineral resources) also has a negative effect of productivity.
vii. Mobility of factors:
The degree of factor mobility also affects labour productivity. When labour and capital move from industries with lower rates of remuneration to higher-paying industries, the productivity of both inputs rises. Here of course, we assume that the factor inputs are not weighted on an industry basis.
viii. Stability of demand:
Finally, the growth of demand and output itself affects productivity. If demand for a product increases steadily and its market becomes wider, there are opportunities for economies of scale.
In the words of Kendrick, “The degree of cyclicity of demand also influences productivity. A relatively stable growth rate is more favourable than fluctuating demand. If growth is measured between years of different rates of utilization of capacity, this, too, will affect the rate unless adjusted for it”.
6. Productivity of Materials:
Material productivity in manufacturing units is a vital factor in ensuring a high level of effectiveness and efficiency. It is because raw materials, and bought-out components’ costs, usually constitute a high proportion of the total cost of most manufacturing organisations.
The productivity of materials is often more significant than that of labour. So it justifies a correspondingly high degree of analysis and control.
If an efficient tailor is able to cut 11 suits from a bale of cloth from which an inefficient tailor can only cut 10, we can say that the former has raised the productivity of the bale of cloth by 10%. In other words, he has used the bale with 10% greater productivity.
The measurement of materials productivity is best done as ‘material yield’. ‘Yield’ is the weight of finished products accepted by customers when compared with the weight of all materials issued for production purposes.
In other words, it is the difference in weight between what is input to a process or production line and what is eventually sent to a customer. Percentage yields should be calculated both for individual operations and for each production line being studied. Improving material productivity is one of the most direct and important ways of enhancing added value.
7. Productivity of Capital:
If a machine tool has been producing 10 pieces per day and through the use of improved cutting tools its output in the same time is increased to 12 pieces, the productivity of that machine is said to have increased.
Capital productivity may be described as the arithmetical ratio between the amount produced and the amount of capital used in the course of production. To measure productivity we have to think in terms of time, “since it is the output of goods or services from a machine or from a worker in a given number of machine-hours”.
One of the major problems facing the financial manager of a company is to take decision on its capital requirement from time to time.
Production decisions are short-term decisions but capital investment in a company will be based on the expectation of the net yield from using an additional unit of capital, after deducting the cost of raising that capital. The economic usefulness of capital is measured by its marginal efficiency or by the rate of return over cost.
8. Productivity of Management Resources:
Land, labour and capital are the three basic inputs of the production process. But they do not make contribution to total output separately or independently. They produce goods and services only when brought together in the presence of an organizing authority or catalyst. This catalyst is, of course, management, and the three factors of production are the resources or inputs at the disposal of management.
Quote: “The Manager is the dynamic, life-giving element in every business. Without his leadership ‘the resources of production’, remain resources and never become production. In competitive economy, above all, the quality and performance of the managers determine the success of a business, indeed they determine its survival. For the quality and performance of its manages is the only effective advantage an enterprise in a competitive economy can enjoy”. [P. F. Drucker: The Practice of Management.]
Drucker and others have recognised the catalytic role of management in relation to the resources of production. Clearly “the practice of management involves decision-making, the designing of plans and strategies, and the general utilization of resources in the most effective manner with respect to the objectives of the company. In general, therefore, management can be defined as the function of governing, involving the determination and co-ordination of the activities of the company”.
Management means getting other people to do the things one wants them to do. It is the practice of deciding for others (the managed), the use of all resources, and getting others to implement these decisions.
i. Appraising Management:
There have been numerous attempts to appraise a company’s management. Frequently, such an appraisal is called a management audit.
It consists of the following activities: The examination of management’s methods and performance which involves a review of the objective, the procedures, the delegation of responsibility, the standards and accomplishments. The operating effectiveness of the area under study can be ascertained by a comparison of the present conditions with those that were intended by policies, procedures and so forth.
Scientific appraisal involves the process of measurement, and checking of principles, to ascertain whether or not the plan, the policy, the system or the procedure, is best under the particular circumstances. After securing the facts, the process is to evaluate the data in order to make sound recommendations for improvement.
Other attempts to evaluate a company management are based on certain check lists. Each item provides a means of evaluation of management although each is assigned a different weight. The representative items are the following—the extent to which the company will continue to grow, the degree of high wages, high efficiency and high cost, and the degree of safety and sanitation.
The remaining categories deal with “the degree to which the company attained a self sustaining organisation structure, the degree the company had produced for domestic and foreign consumption, the degree to which the company contained harmony and production consciousness and the degree of the modernization of production methods and techniques”.
ii. Economic Impacts:
At an industry level, relative changes in productivity and in prices are negatively correlated in the long run. If all firms face the same factor prices, firms with the largest productivity gains show the smallest increases in unit costs and prices, and vice versa. In other words, productivity growth can offset rising factor prices and thus reduce average cost.
Secondly, industries experiencing rapid increases in productivity and rapid decreases in relative price, do better in the export markets. International differences in productivity influence the terms of trade (relative price of exports and imports) and the rate of exchange (i.e., currency values).
Finally, at the national level, growth of real income per capita, is the product of increases in factor input per capita and of total factor productivity.
Some Worked-out Examples:
Example 1.
Sen & Co. of Bombay, manufacturing TV set produced 20,000 TV sets by employing 100 people at 8 hours/day for 25 days. Then

Therefore, the production of TV sets has increased 20% (from 20,000 to 24,000), but the labour productivity has not increased.
Similarly, it can also be shown that labour productivity has decreased although production is increased, or, labour productivity has increased along with production.
This shows that production increase does not necessarily mean increased productivity. A decrease in ‘direct man-hours’ can be interpreted as increase in labour productivity.
Here is another example showing the confusion in interpreting the term productivity.
Example 2.
Suppose X & Co. has reduced the direct man-hours from 1000 last month to 700 this month. From this the management may be under the impression that the productivity has improved 30% this month, while actually, this reduction in ‘direct man-hours’ may have been associated with a corresponding 30% reduction in the number of units produced. The high absenteeism rate, for which direct man-hours have been reduced, should be a concern to the management, instead of a false satisfaction of improvement in productivity.
Thus, it is clear that the company is not following the correct definition of productivity.
Example 3.
A manufacturing company’s data for output produced and inputs consumed for a particular time period are given below:

These values are in constant rupees with respect to a base period.
The partial, total factor, and total productivity values can be computed as follows:

If the company purchases all its materials and services, inclusive of energy, machinery, and equipment (on lease), and other services, i.e., marketing, advertising, information processing, consulting etc., then,
net output = 2,000 – (400 + 600 + 200 + 100)
= 2,000 – 1,300
= Rs. 700.

Example 4.
Break-even concept of Total Productivity:
A company manufactures three products during a certain period by using some levels of inputs to produce some output value.

We are to calculate total productivity, total profits in terms of total productivity, the breakeven point of total productivity and the linear relationship between total productivity and profits of the company.


Thus, we find that the company has made a profit of Rs. 5,600 by operating the business with a total productivity of 1.1 rupees of output/rupee input.
Hence, the company should have exceeded its break-even point of total productivity in order to get this profit.
The break-even point of total productivity can be calculated as follows:
Total productivity (breakeven)

We can show the linear relationship between the profits and the total productivity of the company as follows:

This relationship is useful in setting target values of productivity-oriented profits when target levels of total productivity are available and vice-versa.
Example 5.
X and Co. is a small sized company employing 240 employees and hence sophisticated production scheduling is not desirable. The production manager, having industrial background, develops a simple manually operated production scheduling system on the basis of shortest possible time sequencing rule.
The total cost of introducing the new system is Rs. 20,000, but the inventory costs are very much reduced. Actually, the effect of this system on the total capital input is a reduction of 30%, from the previous figure of Rs. 1, 30,000. Other input factors remain unchanged at Rs. 90,000.
If the total output prior to introduction of scheduling system was 3, 20,000 and it is increased by 6%, what is the effect of the production scheduling system on the total productivity?
Answers:
(a) Prior to the introduction of production scheduling system:
Output = Rs. 3, 20,000.
Input = Rs. 90,000 + 1, 30,000
= Rs. 2, 20,000.
Total Productivity = Output/Input = 3, 20,000/2, 20,000
= Rs. 1.454/rupee.
(b) After the introduction of the production scheduling system:
Output = Rs. 3, 20,000 x 1.06 = Rs. 3, 39,200
Input = Rs. 90,000 + (1 – 0.60) x 1, 30,000 + 20,000
= Rs. 90,000 + 52,000 + 20,000
= Rs. 1, 62,000.
... Total Productivity = Output/Input = 3, 39,200/1,62,000
= Rs. 2.094/rupee.
Therefore, the production scheduling system has a significant positive effect of 44.02% on total productivity.