
In this article we will discuss about Demand:- 1. Meaning of Demand 2. Laws of Demand 3. The Demand Function 4. Shifts.
Meaning of Demand:
In traditional economics it is often assumed that the only factor that affects the quantity of a good or service purchased is its price.
But economists, while stressing the importance of price, also recognise that a host of factors determine the quantity of a goods or service demanded by consumers during a given period. But, in order to keep the analysis simple, economists lay stress on the more important influencing forces and ignore those that have little or no effect.
In this context, one may note that demand implies something more than a need or want. In economics, demand does not just refer to the desire (willingness) to buy a commodity. For example, the desire to buy Maruti cars is universal. But such desire carries no significance unless they are backed up by purchasing power (i.e., capacity to pay).
ADVERTISEMENTS:
Thus, in addition to a need or want, an individual must have purchasing power in order to satisfy that need or want. Thus demand for a commodity refers to the quantity of the commodity consumers are willing to buy (at each of the several prices at a particular time or under given conditions) and ready to pay for.
As a general rule, economists assume that the quantity of a good or service that individuals are willing and able to purchase during a fixed period of time depends upon five major variables:
(1) The price of the good itself,
(2) The income of the buyers,
ADVERTISEMENTS:
(3) The prices of related goods and services,
(4) The expected price of the good in future periods, and
(5) The tastes of the consumers.
Consumers are desirous and capable of buying more of a good the lower the price of the good, when the other variables are held constant (i.e., the ceteris paribus). This important relation is called the law of demand.
ADVERTISEMENTS:
The market demand schedule may be expressed in tabular form, and it can be graphed. When a demand schedule is graphed, it is often called a demand curve.
Laws of Demand:
The inverse relationship between the price of a good and the quantity of it demanded is observed in reality with such regularity that it is known as the law of demand. This observed regularity means that the law of demand is an empirical (statistical) law. An algebraic expression of the relationship between price and quantity demanded is known as a demand function.
The law of demand holds because, when the price of a good increases, consumers tend to buy less of it and more of other goods. The converse is also true. In the event of a fall in the price of a good, consumers tend to buy more of that good in place of other goods that are now relatively more expensive.
Next we may look at income changes. If we hold the other variables constant, an increase in income can cause the quantity demanded of a commodity either to increase or to decrease. If an increase (a decrease) in income causes quantity demanded to increase (decrease) we refer to such a commodity as a ‘normal’ good, that is, in which case income and sales vary directly.
However, there are commodities the quantities demanded of which may fall when income rises, other variables held constant. These types of commodities are known as ‘inferior’ goods.
Commodities are related in consumption in either of two ways: as substitutes or complements. In general, goods are substitutes if one good can be used in the place of the other; an example might be Maruti cars and Fiat cars. If two goods are substitutes, an increase in the price of one good will increase the quantity purchased of the other (holding the price of the good under consideration constant).
If the price of Maruti Car rises while the price of Fiat car remains constant, we would expect consumers to purchase more Fiat cars. A fall in the price of a substitute good will reduce the quantity purchased of the other good.
For example, if the price of tea falls, we would expect the quantity of coffee purchased to fall, given a constant price of coffee. Goods are said to be complementary if they are used in conjunction with each other.
Examples might be tennis racket and tennis ball or cars and petroleum. An increase in the price of either of the complementary goods will lead to fall in the quantity demanded of the other goods, the price of the other good held constant.
ADVERTISEMENTS:
However, all commodities are not necessarily either substitutes or complements in consumption. Various commodities are essentially independent. For example, one cannot expect the price of butter to significantly influence the sales of shoes. Thus, we can treat these commodities as independent and ignore the price of butter when evaluating the demand for shoes.
Expectations of consumers also influence the quantity demanded of a commodity. To be more specific, consumers’ expectations about the future price of the commodity can change their current purchases.
If consumers expect the price to be higher in a future period, sales would probably tend to rise in the current period. On the contrary, expectations of a price drop in the future would cause some purchases to be postponed; thus sales in the current period will fall.
Finally, a change in taste or preferences can change the quantity demanded of a commodity, the other variables held constant. Clearly, changes in taste and preferences could either increase or decrease sales of a product such as readymade garments.
ADVERTISEMENTS:
Since it is difficult to measure taste, economists normally take this variable as constant. However, this factor is very important in understanding the effects of advertising, which shifts demand from one product to another.
We can express the function describing the quantity that consumers are willing and able to purchase during a particular time period as:
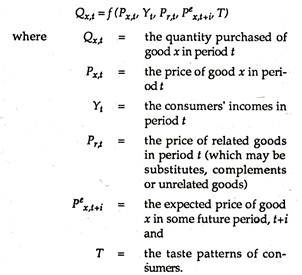
The effects of changes in the variables that determine the quantity demanded (or bought) in a market during a fixed period of time may be summarized as follows, where the symbol Δ denotes “the change in”:
ADVERTISEMENTS:
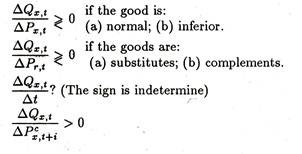
It may be repeated that these relations hold if all other things remain the same. An increase in the price of the commodity will lead to a decrease in quantity demanded as long as the other variables — income, the price of related commodities, taste, and price expectations — remain unchanged.
The Demand Function:
The demand function shows the relation between the quantity demanded of a commodity by the consumers and the price of the product. These functions are probably the most important tools used by economists. While many variables determine the quantity consumers wish to purchase in a market, the price of the commodity is perhaps the most important one.
In this context, we may distinguish between individual demand and market demand. The former refers to the quantity of a good that an individual stands ready to buy at each of several prices, at a particular time, under given conditions.
The latter consists of the total quantity of a good that would be bought in the aggregate by individuals and firms, at each of the various prices, at a fixed point of time. The demand schedules may be graphed or shown in a tabular form. When a demand schedule is graphed, it is called the demand curve.
Now we may suggest the following definition of a demand function:
ADVERTISEMENTS:
A demand function is a list of prices and the corresponding quantities that individuals are willing and able to buy at a fixed point of time. We may note at the outset that demand is a function (or schedule), not a specific quantity. It is formally defined as a schedule of the total quantities of a commodity or service that will be purchased at various prices at a particular point of time.
Hence when we refer to the demand for meat or the demand for motors cars in India, we are considering the amounts that consumers are willing and able to purchases at various prices.
The word ‘demand’ is a broad concept referring to the entire schedule of quantities and prices. But the term ‘quantity demanded’ refers to a single point on the demand schedule or curve. It shows the maximum quantity demanded at a particular price.
We generally specify consumer demand in any of the three ways: as a schedule, a graph, or a function. A typical market demand schedule is shown in Table 6.1. This table shows the list of prices and the corresponding quantities that the consumers demand per unit of time (say, a day or a week).


Quite often it is more convenient to work with the graph of a demand schedule, called a demand curve, rather than with the schedule itself. Figure 6.1 shows the demand curve which is a graphical representation of the demand schedule presented in Table 6.1. Each price-quantity combination — (Rs. 6, 2,000), (Rs. 5, 3,000), and so on — is plotted. The locus of such points (each one showing a particular combination of p and q) DD’ is the demand curve.
ADVERTISEMENTS:
The demand curve indicates the quantity of the good consumers are willing and able to buy at a fixed point of time at alternative prices, i.e., at every price from Rs. 6 to Re. 1. Since price and quantity demanded are inversely related, the curve slopes downward.
Indeed, all market demand curves (which are arrived at by adding up demand curves of individual consumers) are downward sloping because of the law of demand. Individuals purchase less when price rises. Furthermore, as price increases, some individuals do not purchase anything at all, again causing the quantity demanded at each price to fall.
Alternatively, we can express demand as a function
Qx = ƒ(Px)
In this function, the other variables (income, and so on) are held constant. The quantity demanded of a commodity is a function of the price of the good, holding constant the other (proximate) determinants of demand.
Substitution and Income Effects of a Price Change:
ADVERTISEMENTS:
When the price of a good falls and price of other goods are unchanged, buyers in a market respond under the influence of two different (separate) effects.
Firstly, consumers may substitute other goods by the good whose price has fallen.
Secondly, consumers are able to buy greater quantities of this good (and of other relatively more expensive goods) with the same income, which is equivalent to an increase in real income.
These two effects of a lower price are called, respectively, the substitution effect and the income effect. The effects are normally reinforcing since both tend to encourage consumers to buy a larger quantity when price falls. There are also substitution and income effects of a rise in price, but, of course, the effects normally encourage consumers to buy less, not more, when the price is raised.
Let us consider a rise in the market price of wheat. The higher price of wheat will effect consumers in two ways.
Firstly, consumers experience the substitution effect since some will substitute rice and other products for wheat products that are now comparatively more expensive.
ADVERTISEMENTS:
Secondly, consumers experience an income effect since they are relatively poorer as the result of an equivalent decrease in real income or purchasing power.
Consumers may buy less of many goods, including wheat products. The two effects normally go hand in hand, which simply means that each one encourages consumers to buy a lesser quantity of wheat products when the price of wheat rises.
Exceptions to the Empirical Law of Demand:
There are certain exceptions to the Law of Demand. Firstly, we observe that, in some cases, consumers buy more when price is high than when it is low. In fact, when consumers lack complete knowledge of a product, they take price as the index of quality such as costly watches or nasal spray or car wax. However, this is not a true exception to the Law of Demand.
Another possible exception occurs in case of items having snob appeal. Jewellery and costly dresses, for instance, are often purchased because they are expensive. Buyers of such goods derive psychic satisfaction from the fact that they cannot be afforded by people with lower incomes to whom the buyers wish to be superior.
There are, however, goods that have unusual income effects. The substitution effect is always negative, implying that “when the price of a good rises relative to other goods that satisfy more or less the same needs or desires, the relatively low- priced good is substituted for the relatively higher-price goods”.
By contrast, income effect may be negative or positive and may reinforce or be in conflict with the substitution effect depending on the nature of the commodity under consideration.
When an increase in income leads to increased consumption of a good, it is called a normal (superior) good. Most commodities that we consume in real life fall in this category. On the other hand when an increase in the income of buyers leads to a fall in the consumption of a good it is called an inferior good. Inferior goods are those that have a preferred but more expensive substitute.
As income rises, consumers can afford more of the expensive substitutes. For example, white bread may be preferred to ordinary bread, cigarettes to bidis or costly soaps and perfumes to low priced ones.
Income effect is positive in case of normal goods and negative in case of inferior goods. True exceptions to the law of demand will materialize only if the negative income effect of an inferior good outweighs the substitution effect (which is always negative). This condition is unlikely to be fulfilled in the real world. At present there is no such example. Hence it is a rare exception to the Law of Demand.
The reason for this is easy to find. It is quite unlikely for a fall in the price of a good to increase consumer’s real income (or purchasing power) substantially or for an increase to reduce real income drastically.
For instance, if one representative consumer had an annual income of Rs. 50,000 and found that the price of a package of shaving blades purchased once a week had fallen from Rs. 1 to 50 p., the saving of Rs. 26 per year is certainly the equivalent of an increase in the real income. But the increase is very slight.
Moreover, the effect of the ‘marginal’ increase in his real income from a change in price of a single good would be small, if not negligible. Thus, it would seem that “the change in real income from most relevant price changes in the case of inferior goods makes it most unlikely that the income effect from a change in the price of an inferior good would out-weight the substitution effect and thus cause a demand curve to slope upward”.
However, such cases are possible in theory at least. In 19th century, Sir Robert Giffen of Britain noted, for example, that “by far bread was the cheapest food in the diets of the poorest labouring families in England. When the price of bread rose, he pointed out, it so drained the resources of these poor families that they were forced to curtail their meager consumption of meat and the more expensive ‘farinaceous’ foods. Bread was still the cheapest food that they could get and would like. So to replace the calories lost from meat, they consumed more and not less bread even after the rise in the price of bread”.
This phenomenon illustrates a perverse demand relation and is popularly known as Giffen’s Paradox.
Shifts in Demand:
From our earlier discussion we know that price is not the sole determinant of the amount of the commodity consumers wish to purchase. Obviously, the amount of carrot or number of motor cars consumers wish to purchase during a given period depends on other variables, including income, the price of related goods and so on.
In other words, changes in these other variables could cause changes in the quantity demanded at each price, i.e., they change (shift) the demand curve to a new position. We refer to these other variables as the determinants of demand since they determine exactly where the demand function will be located.
As we noted earlier when we plot a demand curve like the one in Figure 6.1, we make the assumption that all other things remain unchanged during the period under consideration.
The other things are:
(1) Buyers incomes (and the pattern of income distribution among buyers),
(2) The prices of related goods (i.e., substitutes and complements),
(3) Price expectations, and
(4) Tastes.
Change in any other variable will cause change in demand. Demand is said to increase or decrease only if one (or more) of the determinants of demand changes. For example, if incomes of consumers increase and they wish to buy a larger quantity of a good at each price than they did before, the demand for the good is said to have increased.
That is, consumers demand more at each price in the list of prices. If the change in income causes consumers to demand less of the good than before at each price then demand is said to have decreased. This happens in case of inferior goods.
Thus, in any discussion of the principles of supply and demand it is customary to distinguish between:
(1) Changes in quantity demanded of a commodity due to a change in its own price, and
(2) Changes (shifts) in demand due to changes in one or more of the determinants of demand (e.g., income).
Figure 6.2 might make this difference clear.

In Figure 6.2, the original demand curve is given by D0D’0. Given this demand curve, at a price of Rs. 12 the quantity demanded by all consumers is 2,100 units. If price falls from Rs. 12 to Rs. 8, the quantity demanded will increase to 2,500 units. Changes in quantity demanded are caused only by changes in the price of the product itself and are reflected in movements along the same demand curve.
Now, starting from the same demand curve D0D’0, we may consider a change in demand. Let us suppose that income falls and the commodity under consideration is a normal good. Consumers will now demand less of the commodity at each price. The demand for the product will fall as is illustrated by the leftward shift of the demand curve from D0D’0 to D1D’1 in Figure 6.2.
At each price, quantity demanded is less than before, e.g., at a price of Rs. 12 per unit the quantity demanded is now 1,000 units. In this example, the fall in the amount consumers are willing and able to purchase (from 2,500 to 1,000 at a price of Rs. 12 per unit) is the result of a change in demand.
By contrast, an increase in demand would be as illustrated by the rightward shift of the demand curve from D0D’0 to D2D’2 in Figure 6.2.
In either case, changes in demand are caused by changes in one or more of the determinants of demand (income, prices of related goods, price expectations, and taste). Changes in demand are shown in shifts of the demand curve, either to the right (for an increase in demand) or the left (for a decrease in demand).
We may now have a more specific look at the effect of changes in the various determinants of demand, starting with income. We have just noted that an increase in income causes consumers to demand more of the good at every price, provided the good is a normal good. If the good is inferior, consumers will demand less of the good at every price after an increase in income.
Thus, an increase in income increases the demand (shifts the curve rightward) for a normal good but decreases the demand (shifts the curve leftward) for an inferior good. The converse is also true; a decrease in income will decrease (increase) the demand for a normal (an inferior) good.
If goods A and B are substitutes, an increase in the price of good B will cause an increase in the demand for A. For example, if the price of Fiat Car increases by Rs. 5,000, we would expect consumers to demand more Ambassador cars for each relevant price. If two goods are substitutes, an increase (decrease) in the price of one will cause the demand for the other to increase (decrease).
On the contrary, if two goods are complements, an increase in the price of one good will decrease the demand for the other. For example, since bread and butter and usually consumed together, they may be treated as complements.
If the price of butter rises, consumers are likely to demand less bread at each price, because the good used with bread is now more expensive. In case of two complementary goods the price of one good rises (falls), we would expect the demand for the other to decrease (increase).
Consumer demand is also affected by price expectations, i.e., expectations regarding future prices. Thus when the price of a good is expected to increase (decrease) in the future, the demand for the good in the current period will increase (decrease).
For example, widespread consumer expectation that prices of VCRs will fall in near future will cause some consumers to postpone purchasing a VCR and, therefore, cause a decrease in the current demand for VCRs.
It is extremely difficult to quantify tastes. We can only say that if something causes consumer’s tastes to change toward (away from) a particular good, the demand for that good will increase (decrease). For example, if consumers gradually develop a taste for coffee the market demand for tea will fall.
In Table 6.2, we summaries the effects of selected changes on the market demand for a good say, x. The basic point to note is that the demand schedule or curve for good x is not changed or shifted by a change in its own price. The demand curve for good x is changed or shifted in response to change in any variable other than a change in its own price.
