
The following points highlight the top six pricing models used for the valuation of securities. The models are:- 1. Constant Growth Model 2. Two Stage Dividend Model 3. Dividend Capitalisation Model 4. Earnings Capitalisation Model 5. P/E Ratio Model 6. Other Models.
1. Constant Growth Model:
For equity securities, the market price depends upon the discounted future dividends or earnings flows and the rate of growth of dividends. Thus, P = Value = D/K-g , D = Expected dividend K = Discount rate g = Rate of growth of earnings power.
In this simplified model, dividend flows are assumed to be constant and the rate of growth of earnings fixed.
The discount rate in the above model is subjective and is assumed to be a specific rate such as risk-free market rate or the long-term yield rate on government bonds. A few analysts use the implied discount rate or internal rate of return, which is derived by equating the present value of the projected dividend stream with the current market price.
ADVERTISEMENTS:
The actual selection of the discount rate as the fair rate of return on capital is a concept which is to be defined by the analysts and used as a subjective factor. Many people use a crude discounting model whereby the dividend stream is constant and the discount rate is also fixed as the internal rate of return on the project. In actual fact, the discount rate is a rate on fixed income securities, which are risk-free like government bonds. The yield on Government bonds at 11-12% is taken normally as the risk-free rate in India. But some use the bank rate of 9% as a risk-free return.
Equity Valuation:
The intrinsic value of an equity share depends on the dividends declared by the company.
These models can be broadly classified for simplicity’s sake into:
ADVERTISEMENTS:
(i) Single-period valuation models; and
(ii) Multi-period valuation models.
In these models, the infinite stream of future dividends are valued for the present time as price-dividend ratio. If the net earnings are assumed to be the same as dividends and no retained earnings, then the price-dividend ratio contracts to price-earnings ratio.
(i) Single-Period Valuation Models:
ADVERTISEMENTS:
Assume that — (i) the dividends are paid annually; (ii) the first dividend is received after one year, and (iii) the resale occurs at the end of the year. Then, the price of the share is Po = D1/(1+i) + P1/(1+i) where Po is the current price, P1 is the price after an year, D1 is the dividend after a year and i is the required rate of return.
Example:
A company’s equity share is expected to bring a dividend of Rs. 2 and fetch a price of Rs. 18 after a year. If the investor buys at Rs. 18, there is no capital appreciation. Assuming the required rate of return to be equal to 12%,
![]()
If the investor purchases at Rs. 18, he incurs a loss of Re. 0.14 on every share.
(ii) Multi-Period Share Valuation Model:
An investor would hold the security for more than one period. In this case, the price of the share is given by the formula-
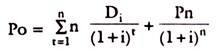
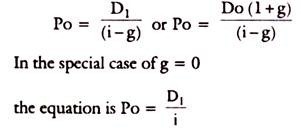
Where, Di is the dividend in period I and Pn is the selling price. In case the dividends grow at a constant rate of g, the equation reduces to-
Example:
The expected earnings per share is Rs. 3 and dividend Rs. 2 respectively. If the required rate of return is 15%, what should be the share price assuming g = 0%, 5% and 10%.
Therefore, when g = O, P = 2/0.15 = 13.33
when g = 0.05, P2/0.15-0.05 = 20
ADVERTISEMENTS:
when g = 0.10, P =2/0.15 – 0.1 = 40
The above example shows how the share price appreciates very high, if the company evinces growth prospects and declares rising dividends.
2. Two Stage Dividend Model:
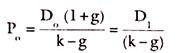
The model for the stock price is given as follows: Here D1 is the dividend in the initial year and D j is dividend in terminal year.
ADVERTISEMENTS:
Here we assumed that dividends will grow at a constant rate for ever and the Stock’s required return is greater than the dividend growth rate which means K > g.
Sometimes the growth rate can be negative when cash dividends are declining in some years. Even so, the above equation can be applied.
The above equation cannot be applied when the dividend growth rate changes after some years, g1 and g2 are two growth rates in two periods, when the two stage growth model can be set out as-
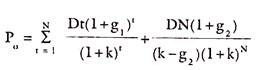
DN stands for dividend per share in time period N and N is number of years that g1 growth rate lasts.
Example:
ADVERTISEMENTS:
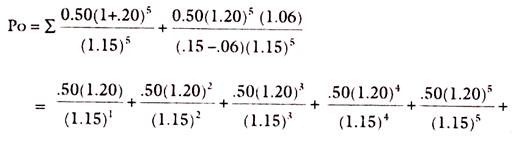
A company “xyz” has experienced a growth rate of 20% for 5 years and then it fell to a more normal level of 6%. The company’s last dividend was Re. 0.50 per share. The required return is 15%.
Here g1 = 20%, g2 = 6%, Do = 0.50
K = 15% or 0.15, N = 5
Applying the above equation, we have-
3. Dividend Capitalisation Model:
Sometimes, the firms do not declare dividends so as to finance their future programmes. In such cases, the dividends are non-existent, but the market prices may be high. In these cases, it is seen that the investors use earnings as a proxy for dividends in the above models. The dividend capitalisation model and the earnings capitalisation model yield the same result only when all the earnings are paid out as dividends. Then there is no growth. P = E1/i where the earnings (E1) (or dividends) grow at a constant rate, then the formula is P = E1/i-g.
ADVERTISEMENTS:
When a portion of the earnings is retained, the dividend capitalisation model is to be used. When growth in the expected future dividends is taken as a function of retained earnings that are reinvested in profitable projects, it is double counting to include both the earnings and the future growth rate of dividends in the same model as the latter depend upon the former also, in part.
4. Earnings Capitalisation Model:
It is to be noted that higher future dividends are an alternative to present dividends and are not an addition to the present dividend stream. If E = D, the firm cannot grow. Thus, the investors who use the price-earnings ratio tend to overstate the market price due to the double counting problem.
In reality, the earnings do not grow at a constant rate nor do the dividends. For theoretical nicety, these assumptions are made. But as limitations, it should be noted that the desired rate of return and the actual rate may not coincide and there is an element of subjectivity in the desired rate of return. Besides, the use of price-earnings ratio following the dividend capitalisation model, suffers from the fact that earnings data are historical but price is the present price, which already takes into account the past dividends, and the future dividend flow may not depend on the past earnings, and price is paid for the future returns.
Use of P/E Ratio:
Many practising analysts use the simple multiplier technique of P/E ratio, but not the present value models referred to above.
ADVERTISEMENTS:
The ratio P/E = Current Market Price/Earnings per share.
By an analysis of the company’s performance, the analyst computes the P/E multiplier (the times P is higher than the earnings per share). In this case, he forecasts the future earnings per share for the next six months or one year and uses this historical multiplier of the same company or of the industry average multiplier to arrive at the market price. The resulting market price is compared with the actual market price to find out whether it is overpriced or underpriced. If it is overpriced, it is to be sold as per the principles of trading operations based on fundamental analysis.
The valuation technique based on discounting is cumbersome and serious forecasting problems arise in the process. The discount rate to be used is a subjective factor and a number of assumptions are required to be made regarding the dividend flows in the present value models. Therefore, analysts and investors use only the P/E ratio for security valuation in practice.
To sum up, the models more commonly used for security pricing are the Dividend Discounting method/Earnings Discounting method and the P/E ratio model.
Dividend Discounting Method:
The expected future dividend payments by the company are discounted to the present day by the use of an appropriate discount rate, which is supposed to reflect the magnitude of risk-free return. The risk premium of stocks may have some risk element and many additional uncertainties. In this model, each of the future year’s dividend up to, say, for ‘n’ years (10 years) is discounted with the appropriate discount rate to the present and summed up to arrive at the worth of the stock today. Dividends are expected to remain constant and the discount rate is assumed to remain unchanged.
ADVERTISEMENTS:
In this simplified model, no provision is made for changes in dividend or for a variable growth of dividend/ earnings. The formula is D/K – g, where D is the dividend, k is the discount rate and g is the constant growth rate of dividends. In this model, the discount rate is a matter of individual perception and is subjective. It is based on the expected depreciation of the rupee and one’s own time premium of the present over the future. Thus, today one rupee may be worth Rs. 1.10 in the next year (a premium of 10 per cent inclusive of inflation).
5. P/E Ratio Model:
The present value of the stock is also arrived at through the assumed relationship between the P/E ratio of a company and that of the average of the whole industry in which the company is. If the company’s P/E ratio and the industry P/E ratio have some relationship, these can be related to derive the industry relative, which can be applied to the company’s earnings per share to arrive at its price. Thus, if P/E for Tea industry has a P/E relative at 15, then for the company in Tea industry say Tata Tea, data on earnings per share can be multiplied by 15 to arrive at its price. If this price is higher than the market price, the security is undervalued and vice versa.
6. Other Models:
Some writers speak of two supplementary guides to valuation which came into fairly wide use, namely, price-to-asset ratio and price-to-sales ratio. According to the first, the stocks of a company are evaluated by reference to the true net asset values using various capital goods and inventory price indices to adjust reported book values. A number of analysts define this as the replacement cost or book value of the company. Some take it as the net working capital per share measured by current assets minus current liabilities, fixed assets minus long-term debt and preferred stock minus intangible assets divided by the number of shares. This is something like the breakdown value of the company’s assets.
According to the second, the average price-to-sales ratio of the industry group is applied to the company P/S ratio to judge whether it is overpriced or underpriced.
A low P/S ratio indicates a low probability of bankruptcy and hence a good buy, if other conditions are satisfied for choosing the company.