
The knowledge of the concept of budget line is essential for understanding the theory of consumer’s equilibrium. A higher indifference curve shows a higher level of satisfaction than a lower one. Therefore, a consumer in his attempt to maximise his satisfaction will try to reach the highest possible indifference curve.
But in his pursuit of buying more and more goods and thus obtaining more and more satisfaction he has to work under two constraints; first, he has to pay the prices for the goods and, secondly, he has a limited money income with which to purchase the goods. Thus, how far he would go in for his purchases depends upon the prices of the goods and the money income which he has to spend on the goods.
Now in order to explain consumer’s equilibrium there is also the need for introducing into the indifference diagram the budget line which represents the prices of the goods and consumer’s money income.
Suppose our consumer has got income of Rs. 50 to spend on goods X and Y. Let the price of the good X in market be Rs. 10 per unit and that of Y Rs. 5 per unit. If the consumer spends his whole income of Rs. 50 on good X, he would buy 5 units of X; if he spends his whole income of Rs. 50 on good Y he would buy 10 units of Y. If a straight line joining 5X and 10Y is drawn, we will get what is called the price line or the budget line.
ADVERTISEMENTS:
This budget line shows all those combinations of two goods which the consumer can buy spending his given money income on the two goods at their given prices. A look at Fig. 8.14 shows that with Rs. 50 and the prices of X and Y being Rs. 10 and Rs. 5 respectively the consumer can buy 10Y and OX, or 8Y and IX; or 6Y and 2X, or 4Y and 3X etc.
In other words, he can buy any combination that lies on the budget line with his given money income and given prices of the goods. It should be carefully noted that any combination of goods as H(5Y and 4X) which lies above and outside the given budget line will be beyond the reach of the consumer.
But any combination lying within the budget line such as K(2X and 2Y) will be well within the reach of die consumer, but if he buys any such combination he will not be spending all his income of Rs. 50. Thus, with the assumption that whole of the given income is spent on the given goods and at given prices of them, the consumer has to choose from all those combinations which lie on the budget line.
It is clear from above that budget line graphically shows the budget constraint. The combinations of commodities lying to the right of the budget line are unattainable because income of the consumer is not sufficient to be able to buy those combinations. Given his income and the prices of goods, the combinations of goods lying to the left of the budget line are attainable, that is, the consumer can buy any one of them.
ADVERTISEMENTS:
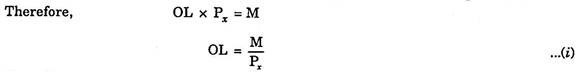
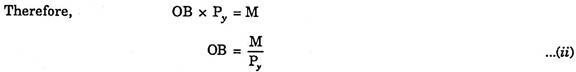
It is also important to remember that the intercept OB on the Y-axis in Fig. 8.14 equals the amount of his entire income divided by the price of commodity Y. That is, OB = M/Py. Likewise, the intercept OL on the X-axis measures the total income divided by the price of commodity X. Thus OL = M/Vx.

The budget line can be written algebraically as follows:
PxX + PyY = M …(8.1)
ADVERTISEMENTS:
Where Px and Py denote prices of goods X and Y respectively and M stands for money income. The above budget-line equation (8.1) implies that, given the money income of the consumer and prices of the two goods, every combination lying on the budget line will cost the same amount of money and can therefore be purchased with the given income. The budget line can be defined as a set of combinations of two commodities that can be purchased if whole of a given income is spent on them and its slope is equal to the negative of the price ratio.
Budget Space:
It should be carefully understood that the budget equation PxX + PyY = M or Y = M/Py – Px/Py . X depicted by the budget line in Fig. 8.14 only describes the budget line and not the budget space. A budget space shows a set of all commodity combinations that can be purchase by spending the whole or a part of the given income. In other words, budget space represents all those combinations of the commodities which the consumer can afford to buy, given the budget constraint.
Thus, the budget space implies the set of all combinations of two goods for which income spent on good X (i.e., Px X) and income spent on good Y (i.e., PyY) must exceed the given money income.
Therefore, we can algebraically express the budget space in the following form of inequality:
PxX + PyY < M or M > PxX + PyY
The budget space has been graphically shown in Fig. 8.15 as the shaded area. The budget space is the entire area enclosed by the budget line BL and the two axes.

Changes in Price and Shift in Budget Line:
ADVERTISEMENTS:
Now, what happens to the price line if either the prices of goods change or the income changes. Let us first take the case of the changes in prices of the goods. This is illustrated in Fig. 8.16. Suppose the budget line in the beginning is BL, given certain prices of the goods X and Y and a certain income. Suppose the price of X falls, the price of Y and income remaining unchanged.
Now, with a lower price of X the consumer will be able to purchase more quantity of X than before with his given income. Let at the lower price of X, the given income purchases OL’ of X which is greater than OL. Since the price of Y remains the same, there can be no change in the quantity purchased of good Y with the same given income and as a result there will be no shift in the point B. Thus, with the fall in the price of good X, the consumer’s money income and the price of Y remaining constant, the price line will take the new position BL’.

Now, what will happen to the budget line (initial budget line BL) if the price of good X rises, the price of good Y and income remaining unaltered. With higher price of good X, the consumer can purchase smaller quantity of X, say OL”, than before. Thus, with the rise in price of X the price line will assume the new position BL”.
ADVERTISEMENTS:
Fig. 8.17 shows the changes in the price line when the price of good Y falls or rises, with the price of X and income remaining the same. In this the initial budget line is BL.

With the fall in price of good Y, other things remaining unchanged, the consumer could buy more of Y with the given money income and therefore budget line will shift to LB’. Similarly, with the rise in price Y, other things being constant, the budget line will shift to LB”.
Changes in Income and Shifts in Budget line:
ADVERTISEMENTS:
Now, the question is what happens to the budget Y line if the income changes, while the prices of goods remain the same. The effect of changes in income on the budget line is shown in Fig. 8.18. Let BL be the initial budget line, given certain prices of goods and income.’ If the consumer’s income increases while the prices of both goods X and Y remain unaltered, the price line shifts upward (say, to B’L’) and is parallel to the original budget line BL.

This is because with the increased income the consumer is able to purchase proportionately larger quantity of good X than before if whole of the income is spent on X, and proportionately greater quantity of good Y than before if whole of the income is spent on Y. On the other hand, if the income of the consumer decreases, the prices of both goods X and
Y remaining unchanged, the budget line shifts downward (say, to B”L”) but remains parallel to the original price line BL. This is because a lower income will purchase a proportionately smaller quantity of good X if whole of the income is spent Changes in Income on X and proportionately smaller quantity of good Y if whole of the income is spent on Y.
It is clear from above that the budget line will change if either the prices of goods change or the income of the consumer changes.
Thus, the two determinants of the budget line are:
ADVERTISEMENTS:
(a) The prices of goods, and
(b) The consumer’s income to be spent on the goods.
Slope of the Budget Line and Prices of two Goods:
It is also important to remember that the slope of the budget line is equal to the ratio of the prices of two goods. This can be proved with the aid of Fig. 8.14. Suppose the given income of the consumer is M and the given prices of goods X and Y are Px and Py respectively. The slope of the budget line BL is OB/OL. We intend to prove that slope OB/OL is equal to the ratio of the price of goods X and Y.
The quantity of good X purchased if whole of the given income M is spent on it is OL.
Now, the quantity of good Y purchased if whole of the given income M is spent on it is OB.

It is thus proved that the slope of the budget line BL represents the ratio of the prices of two goods.