The following article will guide you about the two main methods adopted to measure inequality of income. The methods are: 1. The Lorenz Curve 2. The Gini Ratio.
Method # 1. The Lorenz Curve:
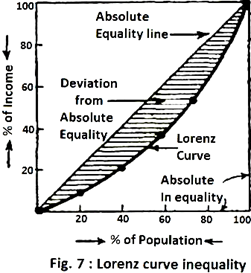
The Lorenz Curve is obtained by plotting the cumulative percentage of the nation’s income against the cumulative percentage of the nation’s households or population receiving this income. Generally, income is represented on the vertical axis of the diagram and households or population on the horizontal axis as shown in Fig. 7.
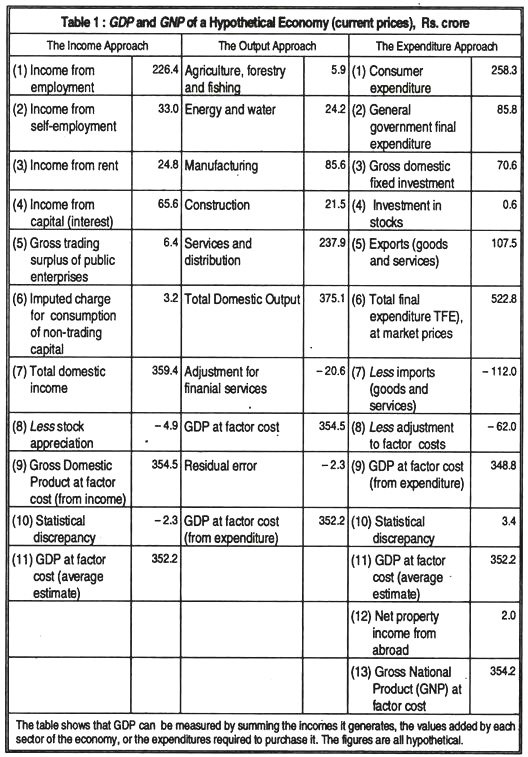
Plotting the figures of the Table 1 in Fig. 1 would result in a straight upward sloping line of absolute equality. The curve on extreme right side of the figure—the right angled line—represents the limiting case of absolute inequality. The Lorenz Curve is given by the indicated intermediate curve with the shaded area indicating the deviation from absolute equality and hence giving us a measure of the degree of inequality of income distribution.

The more unequal the distribution of income, the more curvature there will be in the Lorenz curve. Indeed, if all of the income of a country were received by just one family, the curve would be a vertical line at a right angle to the horizontal axis like the extreme right-hand side of the figure. If there is a trend towards a more equal distribution of income, the Lorenz curve will flatten out and move closer to the straight, bisecting line.
Method # 2. The Gini Ratio:
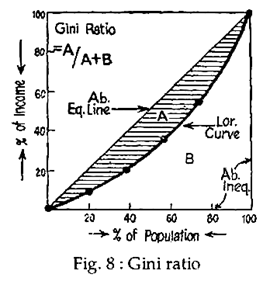
Economists often use another technique to measure describe the distribution of income, viz., the Lorenz ratio or the Gini co-efficient. The Lorenz ratio is derived from the Lorenz curve diagram and is defined as “the ratio of the area between the Lorenz curve and the perfect equality line”. In terms of the Fig.8 given below, it is the ratio of the area ‘A’ over the total area ‘A+B’, i.e., the
ADVERTISEMENTS:
Gini coefficient = A/A + B
The size of the Lorenz ratio can vary from zero to one. As a nation moves closer to perfect equality in its income distribution, the Lorenz ratio will approach zero. This occurs because the area ‘A’ (the numerator in the fraction) becomes smaller and smaller as the Lorenz curve becomes flatter and approaches the line of complete equality.
At the extreme of perfect equality the area ‘A’ disappears, or becomes zero, which means that the value of the fraction (i.e., Lorenz ratio) becomes zero. Conversely, as a nation moves towards absolute inequality of the income distribution, the Lorenz curve approaches the boundaries of the rectangle and the area ‘B’ grows smaller and smaller. At the extreme of complete inequality, the area ‘B’ disappears, so the ratio is equal to A/A or one.


